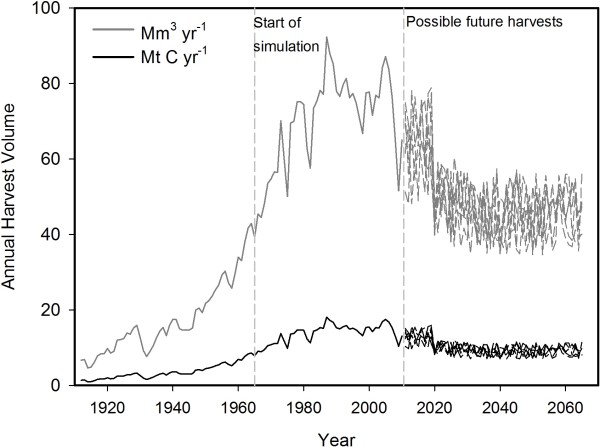
Figure 9.
Harvest volume in cubic metres per year (grey lines) and in tonnes of C per year (black lines) from 1912–2065. BC-HWPv1 used the C data from 1965 to 2065 as input. There is an ensemble of six possible future harvest rates starting in 2011. Future harvests varied between 61 and 100% of the estimated sustainable timber flow to reflect the uncertainty in forecasting.

