
Figure 2.
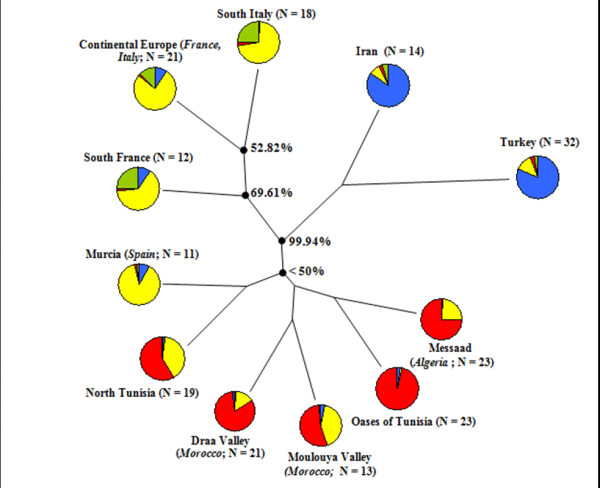
Neighbor-joining clustering of geographic groups based on pairwise Nei’s genetic distance values, as well as the distribution of the genetic clusters within each of them. Colours correspond to genetic clusters defined by the STRUCTURE analysis, as reported in Figure 3, with cluster 1 in blue, cluster 2 in green, cluster 3 in yellow and cluster 4 in red. Numbers next to nodes indicate bootstrap support percentages in 10000 pseudoreplicates.