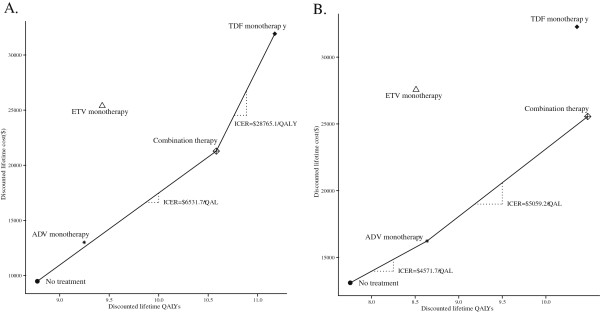
Figure 2.
Cost-effectiveness of rescue therapies for LAM-resistant HBeAg-positive (A) and HBeAg-negative (B) chronic hepatitis B. The x-axis indicates the discounted lifetime quality-adjusted life-years (QALYs) for each therapy, and the y-axis indicates the total discounted lifetime costs (US dollar). The oblique line connects “no treatment” and the most cost-effective therapies; therapies above the straight lines were dominanated. Combination strategy uses LAM and ADV.

