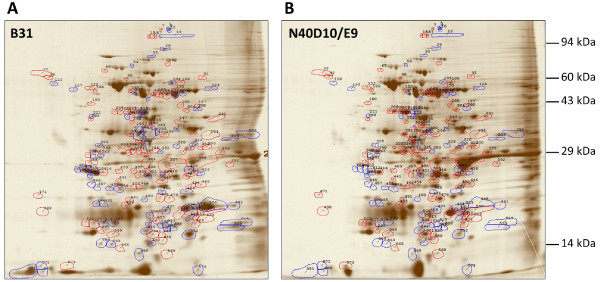
Figure 4.
Two-dimensional gel electrophoresis of B31 and N40D10/E9 strains total proteins. Polypeptide spots with increased relative abundance (more than 1.7 fold increase) in B31 versus N40D10/E9 are outlined in blue while spots with decreased relative abundance (more than 1.7 fold decrease) in B31 versus N40 are outlined in red. Several of these spots were sent for MALDI-MS analysis.

