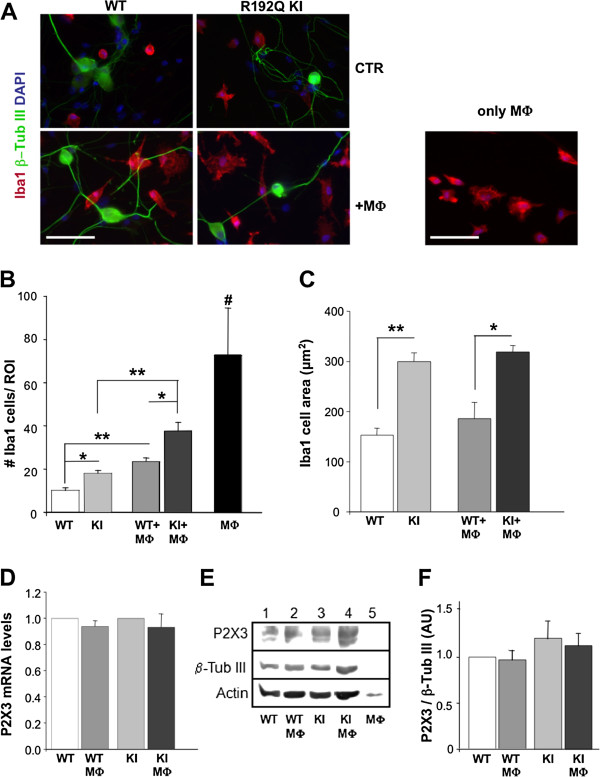
Figure 1.
Activated phenotype of trigeminal ganglion macrophages in vitro. A, Examples of fluorescence microscopy images of cultures from WT or KI trigeminal ganglia immunostained with antibodies against Iba1 (red), β˜-tubulin III (green) and counterstained with DAPI (blue). MФ. indicates co-culturing with known number of host macrophages, while only MФ .indicates pure peritoneal macrophage cultures. Scale bar: 50 μm. B, Histograms quantify the number of Iba1-positive cells in the ROI (640 × 480 μm) from WT or R129Q KI ganglion cultures in control condition and after MФ. addition; n = 3 petri dishes for each group run in parallel, * p < 0.05, ** p < 0.01. MФ .# p < 0.01 vs all conditions. C, Histograms quantify the average cell area (expressed in μm2) for data shown in B, * p < 0.05, ** p < 0.01. D, P2X3 mRNA levels in co-cultures (WT+MФ, KI+MФ) expressed as fold increase in comparison to their controls (WT or R192Q KI cultures) and normalized versus β-tubulin mRNA levels (n = 3 petri dishes for each group). E, Example of western blots shows similar levels of P2X3 receptor expression in lysates from WT or R192Q KI trigeminal cultures (lanes 1 and 3), and in co-cultures (WT+MФ and KI+MФ, lanes 2 and 4). Lysates from MФ only (lane 5) show no signal. β-Tubulin III and actin are shown as loading control (bottom row). F, Histograms show mean values (optical density, AUs) of P2X3 subunits obtained in western blot experiments normalized over β-tubulin III signals; n = 4 petri dishes.

