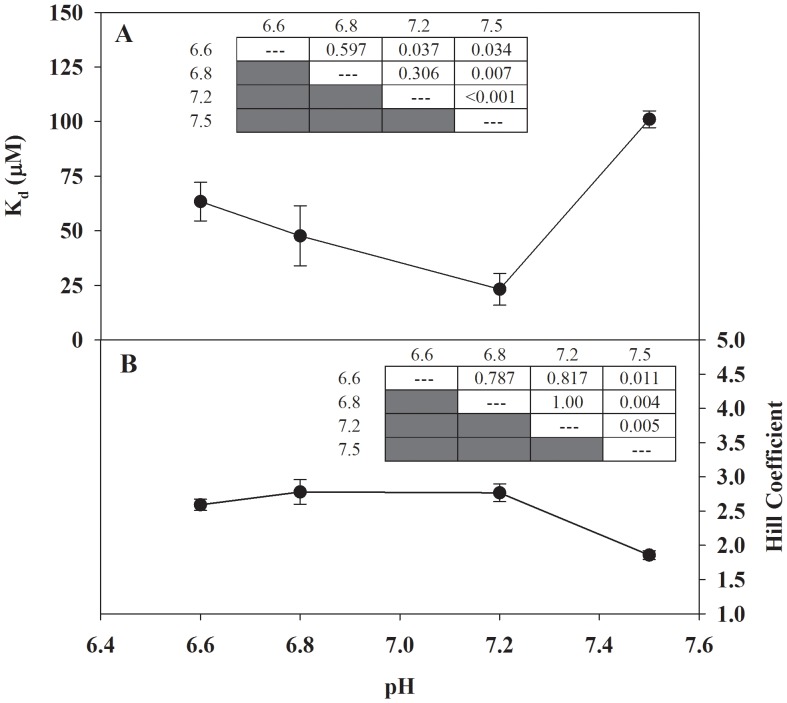
Figure 5. Effect of pH on the apparent dissociation constant (Panel A) and Hill coefficient (Panel B) of Ca2+-binding by FCSQ.
Each data point represents a minimum of three protein preparations run in triplicate. Significant differences were determined using one way ANOVA followed by Tukey HSD multiple pairwise comparisons with significance set at 5%. Inset tables show P values from all pairwise comparisons. Error bars represent S.E.M.

