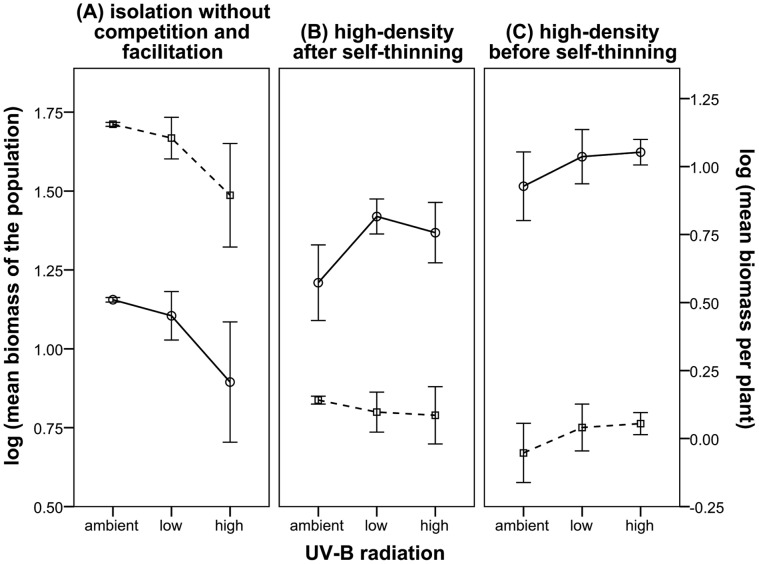
Figure 1. Total and mean biomass of mung beans under different levels of UV-B radiation and density.
Plants were grown for 86 days (three months) under three density levels [1 plant in a pot (isolation), 7 plants in a pot (low-density)] and 37 plants in a pot (high-density)]. The plants were exposed to the following three UV-B radiation levels: 8.05 kJ·m2 UV-BBE (ambient), 8.05+3.60 kJ·m2 UV-BBE (low-enhanced), and 8.05+5.62 kJ·m2 UV-BBE (high-enhanced). There were three replicates for each treatment. The plants were sampled at the end of each month during the whole growing season. The solid line represents the total biomass of the mung bean population, whereas the dotted lines represent the mean biomass. Panels A and B show the last month’s results (strongly self-thinning was observed) and panel C shows the second month’s trends. Data are means ± SD (there are 9 pots for each panel; n = 9 plants in panel A, n = 157 plants in panel B and 333 plants in panel C).

