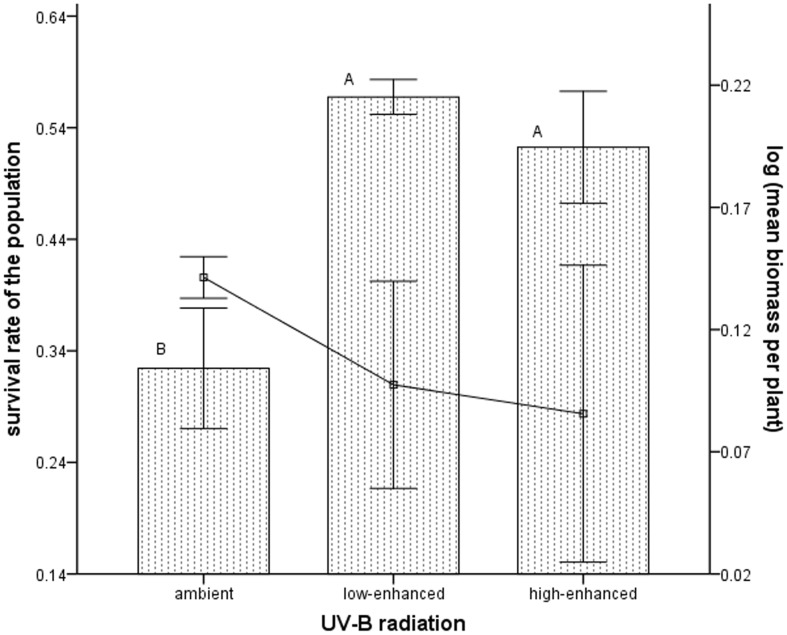
Figure 2. Survival rate and mean biomass under different levels of UV-B radiation in the last stage.
The high-density group under different UV-B radiation levels (ambient, low-enhanced and high-enhanced) showed the relationships between the survival rate (bar) of mung bean population and the mean biomass of individuals of the population (solid line) in the last month during self-thinning. The bars surmounted by different letters are significantly different (P < 0.05) according to Duncan’s test and data are means ± SD (there are 9 pots and n = 157 plants).

