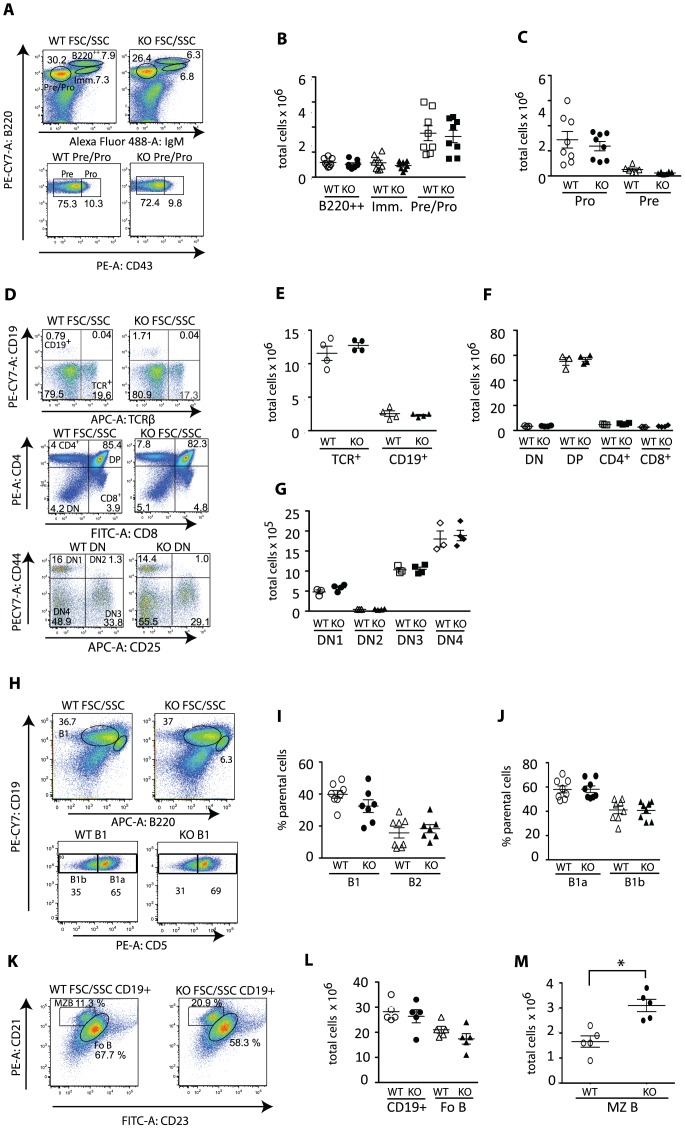
Figure 3. Eps15-KO mice show increased marginal zone B cell numbers.
A. Dot plots of bone marrow cells from 4-month-old Eps15-WT and Eps15-KO mice stained for B220 and IgM to identify pre−/pro-B cells (B220+IgM−), immature (B220+IgM+) and mature (B220highIgM+) B cells. Pre−/pro-B cells were further analyzed for expression of CD43 to identify pro- (CD43+) and pre- (CD43−) B cells. B.–C. Dot plots depicting the total number of mature (B220++), immature (Imm.) and pre−/pro- and B cells (B) and pre- and pro-B cells (C) in the bone marrow of Eps15-WT (WT, white symbols, n = 5) and Eps15-KO (KO, black symbols, n = 6) mice. D. Top panel: dot plot of thymocytes from 2-month Eps15-WT and Eps15-KO mice stained for CD19 and TCRβ to identify B and T cells, respectively. Middle panel: dot plots for thymocytes from 4-month-old Eps15-WT and Eps15-KO mice staind for CD4 and CD8 to identify thymocyte subpopulations. Bottom panel: the CD4/CD8 double negative population (DN) was further analyzed for immature thymocytes using CD44 and CD25. E.–G. Dot plots depicting the total number of the following cell populations in the thymi of Eps15-WT (WT, white symbols) and Eps15-KO (KO, black symbols) mice: (E) TCRβ+ and CD19+ cells (n = 3), (F) DN (double negative, CD4−CD8−), DP (double positive, CD4+CD8+), CD4+ and CD8+ (n = 4) and (G) of DN1 (CD44+CD25−), DN2 (CD44+CD25+), DN3 (CD44−CD25−) cells (n = 4). H. Dot plot of peritoneal B cells from 2–4 month old Eps15-WT and Eps15-KO mice stained for CD19 and B220 gated for CD19+B220low B1 and CD19+B220high B2 B cells. B1 B cells were further stained and gated for CD5 to identify CD5+ B1a and CD5− B1b B cells. I.–J. Dot plots depicting the percentage of B1 and B2 (I) and B1a and B1b (J) B cells in the peritoneum of Eps15-WT (WT, white symbols) and Eps15-KO (KO, black symbols) mice (n = 8). K. Dot plot of splenocytes from Eps15-WT and Eps15-KO mice stained for CD19 and gated for CD21 and CD23 to identify Fo B (CD19+/CD21+/CD23+) and MZ B (CD19+/CD21+/CD23−) cells. L. Dot plots depicting the total number of CD19+, Fo B and MZ B cells in the spleens of Eps15-WT (WT, white symbols) and Eps15-KO (KO, black symbols) mice (n = 5). Values are depicted as mean±standard error mean. Statistical significance was assessed using Student’s t-test and significant differences are indicated as * = p<0.05.

