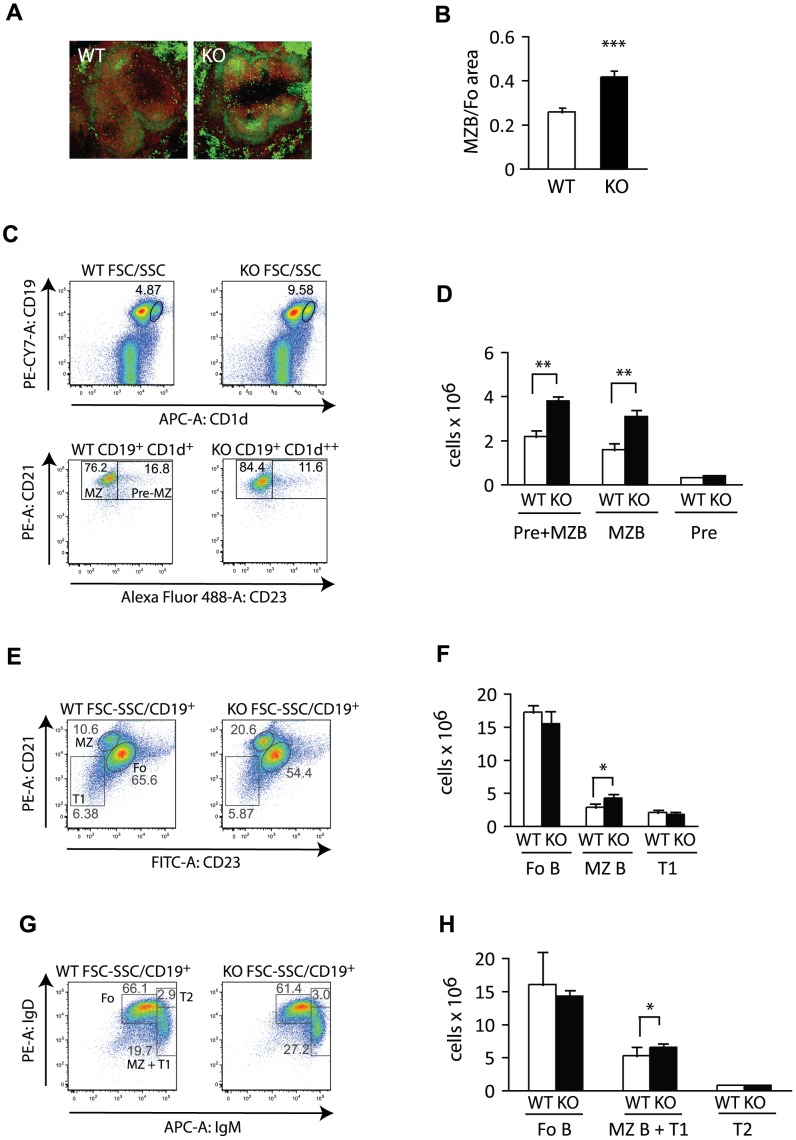
Figure 4. Eps15-KO mice show normal pre-MZ B and transitional B cell numbers. A.
Photomicrographs of spleen sections from adult Eps15-WT and Eps15-KO mice. Sections were stained for IgD (PE, red) and IgM (FITC, green) to visualize MZ B (IgM+IgDlow/−) and Fo B cells (IgD+IgM−). B. Bar graph representing the quantification of the ratio of the area occupied by MZ B cells over the area occupied by Fo B cells in Eps15-WT and Eps15-KO spleens (n = 12 per genotype). C. Dot plots of splenocytes from Eps15-WT and Eps15-KO mice stained for CD19 and CD1d to identify the pre-MZ B plus MZ B (pre+MZB) cell populations. This mixed CD19+CD1d++ population was further analyzed for CD23 to distinguish pre-MZ B (CD19+/CD1d++/CD23+) from mature MZ B (CD19+/CD1d++/CD23−) cells. D. Bar graph depicting total cell numbers of pre+MZB cells, mature MZ B and pre-MZ B cells in the spleens of Eps15-WT (WT, white bars) and Eps15-KO (KO, black bars) mice (n = 5). E. Dot plots of splenocytes from Eps15-WT and Eps15-KO mice stained for CD19, CD21 and CD23 to identify Fo B (CD19+/CD21+/CD23+), MZ B (CD19+/CD21+/CD23−) and T1 transitional B (CD19+/CD21−/CD23−) cells. F. Bar graph depicting total cell numbers of Fo B, MZ B and T1 transitional B cells in the spleens of Eps15-WT (WT, white bars) and Eps15-KO (KO, black bars) mice (n = 5). G. Dot plots of splenocytes from Eps15-WT and Eps15-KO mice stained for CD19, IgD and IgM to identify Fo B (CD19+/IgD+IgMLow), MZ B plus T1 transitional B (MZ B+T1, CD19+/IgDlow/−IgM+) and T2 transitional B (CD19+/IgD+IgM+) cells. H. Bar graph depicting total cell numbers of Fo B, MZ B+T1, and T2 transitional B cells in the spleens of Eps15-WT (WT, white bars) and Eps15-KO (KO, black bars) mice (n = 5). Values are depicted as mean±standard error mean. Statistical significance was assessed using Student’s t-test and significant differences are indicated as *p<0.05, **p<0.01, ***p<0.005.

