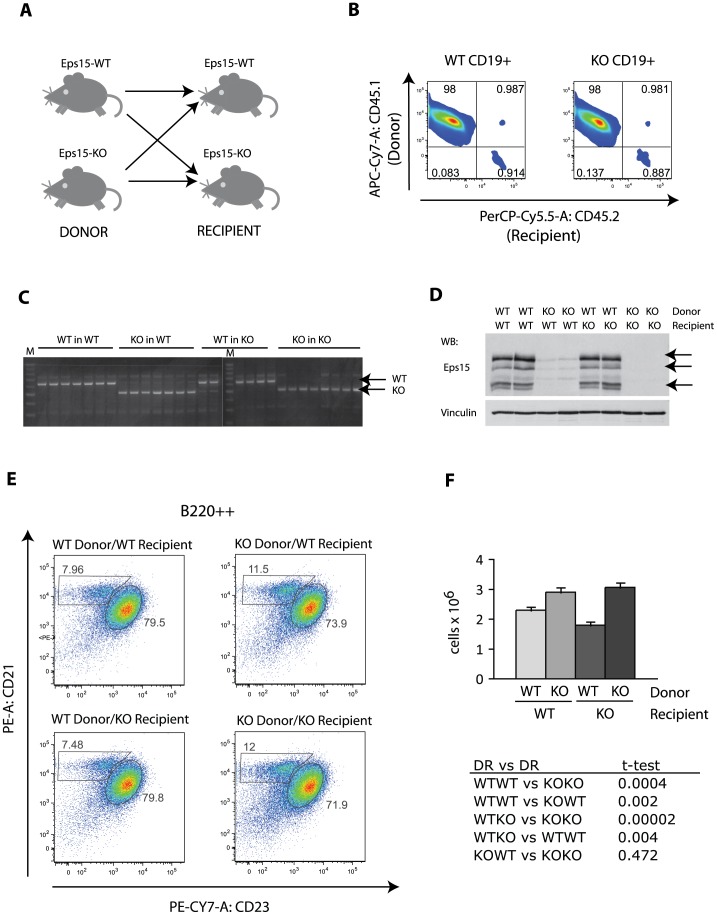
Figure 5. The increase in the MZB cell population in Eps15-KO mice is cell autonomous. A.
Scheme depicting the experimental design of the reverse bone marrow transplantation. Bone marrow cells from Eps15-WT or Eps15-KO mice were transplanted into sub-lethally irradiated Eps15-WT or Eps15-KO mice. B. Dot plot depicting the efficiency of CD45.1+ WT donor cell engraftment in either Eps15-WT or Eps15-KO CD45.2+ recipient mice. Gating CD19+ splenocytes for CD45.1 and CD45.2 expression revealed more than 99% engraftment of donor cells in both types of host. C. PCR genotyping of peripheral blood 2 months after bone marrow transplantation. In mice injected with Eps15-WT cells the resulting genotype is WT, independent of the recipient genotype. Similarly, in mice injected with Eps15-KO cells the resulting genotype is KO, independent of the recipient genotype. ‘M’ indicates marker. D. Western blot analysis of splenocyte lysates 3 months after bone marrow transplantation. The membrane was decorated with anti-Eps15, or anti-vinculin as a loading control. The Eps15-specific bands are indicated by arrows. E. Dot plot of splenocytes 3 months after bone marrow transplantation. Splenocytes were stained for CD19, CD21 and CD23 to identify Fo B (CD19+/CD21+/CD23+) and MZ B (CD19+/CD21+/CD23−) cells for each combination of genotypes. F. Bar graph depicting the total number of CD19+/CD21+/CD23− MZ B cells for each genotype combination (n = 6). The significance was calculated using the Student’s t-test and is reported in the table below the graph.

