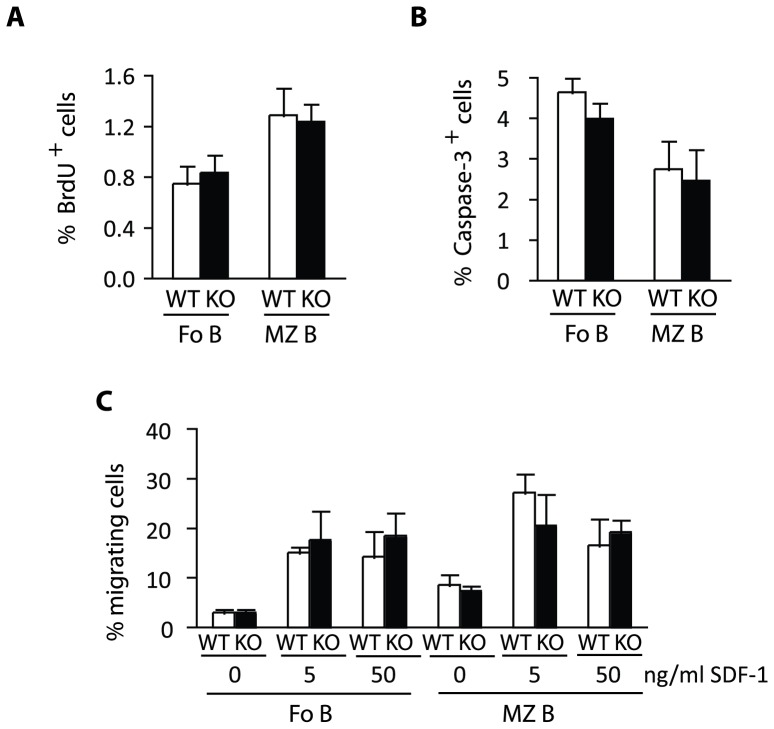
Figure 8. Normal proliferation and apoptosis levels in Eps15-KO MZ B cells. A.–B.
Bar graph depicting the percentage of BrdU-positive (BrdU+) (A) or active caspase-3-positive (Caspase+) (B) in Fo and MZ B cells in 2−4-month-old Eps15-WT (WT, white bars) and Eps15-KO (KO, black bars) mice 4 hrs after a BrdU pulse (n = 8). C. Bar graph depicting the percentage of Fo and MZ B cells migrating towards increasing concentrations of the chemokine SDF-1 in a transwell assay using purified splenic B cells from 3-month-old Eps15-WT (WT, white bars) and Eps15-KO (KO, black bars) mice (n = 4).

