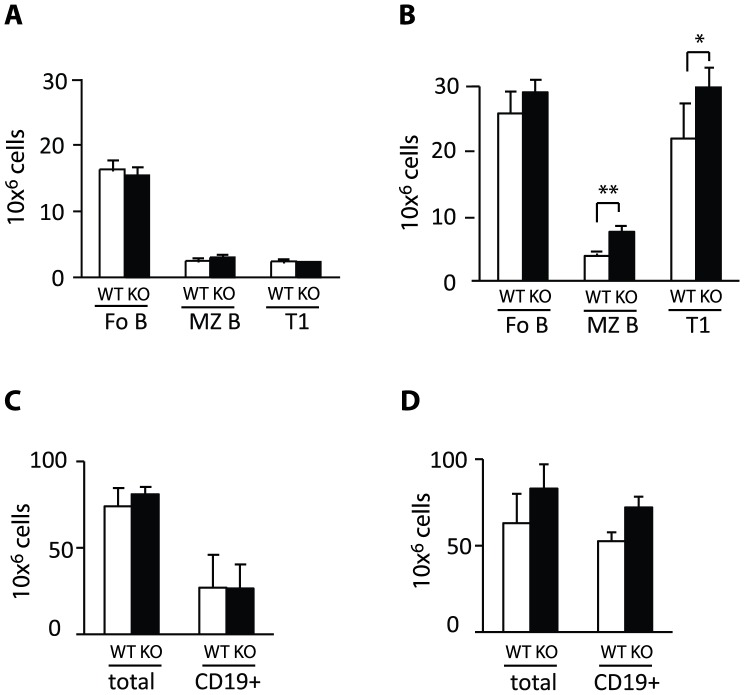
Figure 9. The MZ B cell numbers increase over time in Eps15-KO mice. A.–B.
Bar graphs depicting the total number of Fo, MZ and T1 B cells in the spleen of 2 month old (A) and 24 month old (B) Eps15-WT (WT, white bars) and Eps15-KO (KO, black bars) mice. C.–D. Bar graphs depicting the total and CD19+ cell number in the spleen of 2-month-old (A) and 24-month-old (B) (Eps15-WT (WT, white bars) and Eps15-KO (KO, black bars) mice. Values are depicted as mean±standard error mean. N = 4 per two month old and n = 5 per 24 month old mice. Statistical significance was assessed using Student’s t-test and significant differences are indicated as * = p<0.05, ** = p<0.01.

