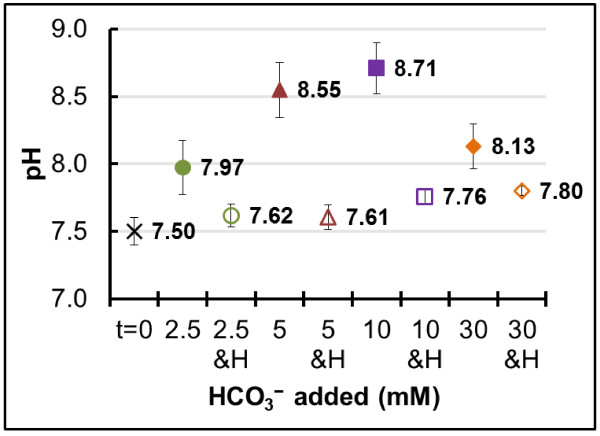
Figure 4.
pH changes resulting from biological HCO3− consumption. Average initial (t = 0) and final pH measurements in all HCO3− amendments from this study in the absence (closed symbols) or presence (open symbols) of HEPES. The error bars are standard deviations of triplicate cultures. The buffer HEPES is denoted as H on the X-axis.

