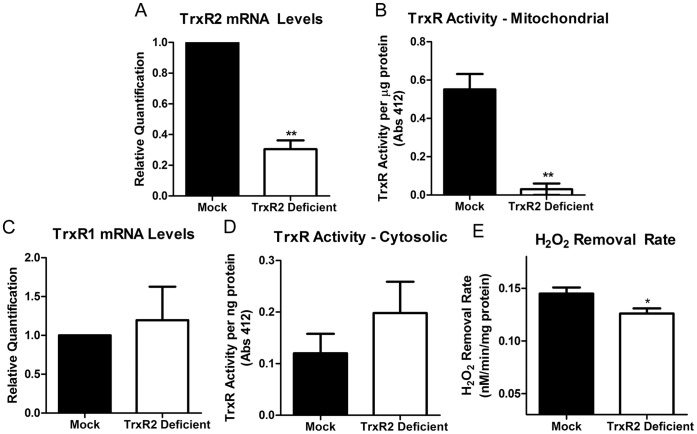
Figure 3. Generation of TrxR2 deficiency in N27 Cells.
N27 cells were transfected with TrxR2 shRNA (TrxR2 deficient) and compared to mock-transfected cells (mock). (a) TrxR2 mRNA expression was measure by real-time PCR. Cells transfected with TrxR2 shRNA had a ∼60% decrease in TrxR2 mRNA compared to mock transfected cells (n = 3−6). (b) TrxR activity was measured in isolated mitochondria from mock and TrxR2 shRNA cells and there was a ∼95% loss in TrxR2 activity in the deficient vs. mock transfected cells (n = 3−6). To determine if the shRNA effect was mitochondrial specific TrxR1 mRNA (c) and TrxR activity (d) was measured in cytosolic fractions. There was no change in TrxR1 mRNA levels or activity (n = 2−6). (e) Mock and TrxR2 deficient cells were exposed to 3 µM exogenous H2O2 and the removal rates were determined with a Clark-type electrode. There was a significant (p<0.001) decrease in the TrxR2 deficient cells ability to remove exogenous H2O2 compared to mock controls (n = 9) Bars represent mean ± SEM. * = <0.05, ** = p<0.005 as determined by two-tailed t-test.

