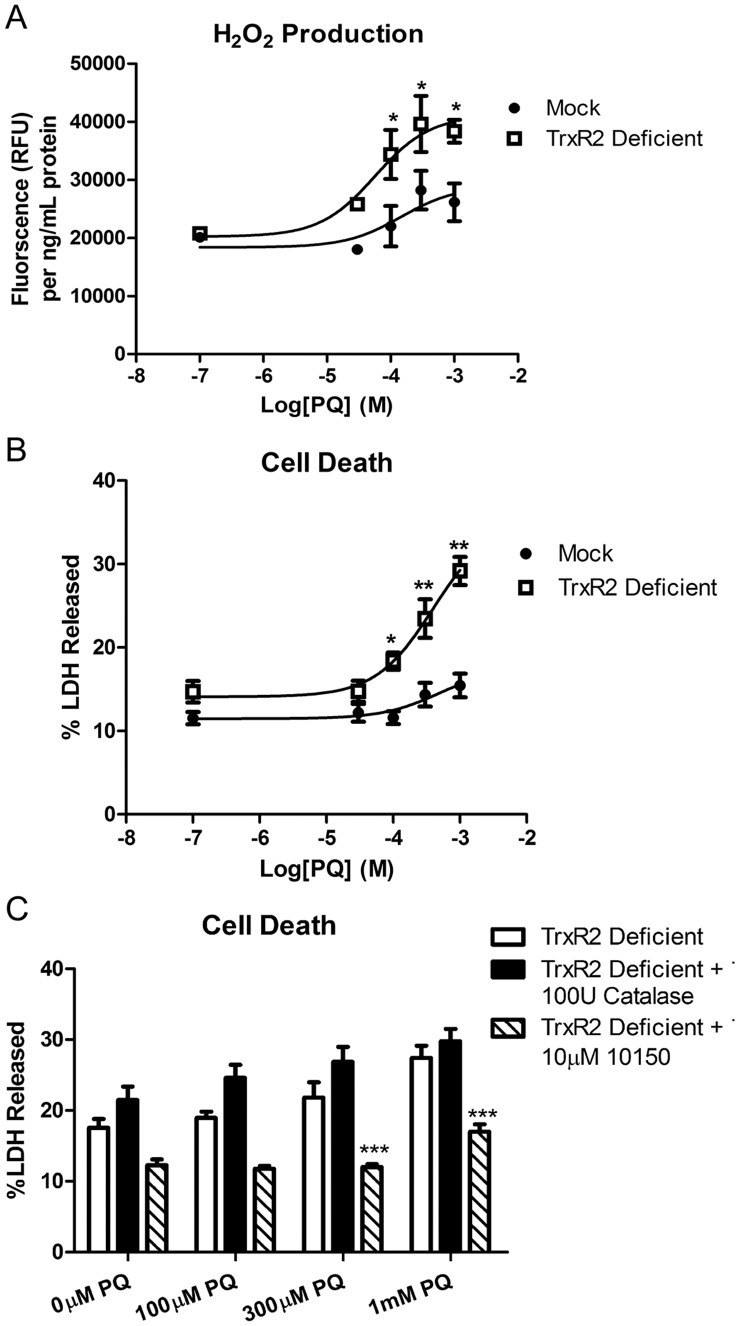
Figure 4. Increased susceptibility to H2O2 production and cell death in TrxR2 deficient cells.
(a) TrxR2 deficient and mock control cells were exposed to varying concentration of PQ for 12 hr and H2O2 production was measured via Amplex Red. At 100 µM, 300 µM and 1 mM PQ concentrations there was a significant increase in H2O2 released in the deficient cells compared to mock controls (n = 6) * = p<0.05 as determined 2-way ANOVA. (b) Cell death was determined in mock and TrxR2 deficient cells after 24 hrs exposure to varying concentrations of PQ (n = 12−16). * = p<0.01, ** = p<0.001 as determined by 2-way ANOVA. (c) TrxR2 deficient cells were exposed to varying concentrations of PQ alone and in combination with the 100 U catalase and 10 µM AEOL10150 for 24 hrs. Catalase was unable to rescue the PQ induced cell death but co-incubation with AEOL10150 was able to significantly decrease %LDH released in TrxR2 deficient cells * = p<0.05, *** = p<0.001 as determined by 2-way ANOVA compared to TrxR2 deficient cells with PQ alone. Data points represent mean ± SEM (n = 6−30).

