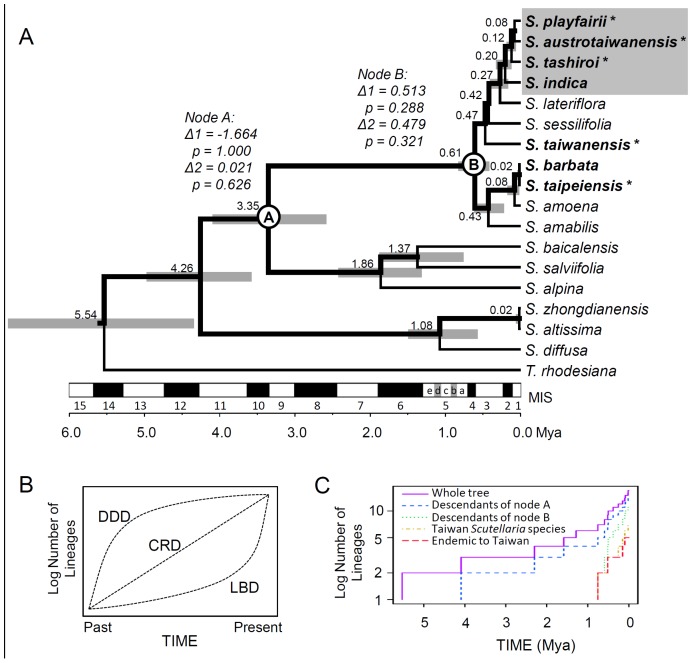
Figure 2. Phylogenetic relationships and the lineage through time (LTT) plots of Scutellaria samples in Taiwan.
(A) Phylogenetic tree reconstructed using CHS, CAD, matK, ndhF-rpl32, and rpl32-trnL under the Yule’s pure-birth speciation model. Bold lines indicate lineage grouping with a posterior probability of >90%; the node labels are the splitting time (unit: Mya); the node bar is the 95% highest posterior density interval of the splitting time; species displayed in bold are those distributed in Taiwan; and the stars indicate species endemic to Taiwan. Species inside the gray box are the indica group. The nodes have inferred diversification rate shifts labeled by nodes A and B. The results of the testing of diversification rate shifts of descendants of nodes A and B inferred by Δ-statistics are indicated with italics. Marine Isotope Stages (MIS) are indicated on the time scales. (B) Idealized log LTT plot showing the expected pattern under the hypotheses of density dependent diversification (DDD), constant rate of diversification (CRD), and late burst of diversification (LBD). (C) The lineage through time (LTT) plot of all Scutellaria samples used in the study. The graph reveals a delayed increase in the lineage accumulation rate in Taiwan species compared to that in descendants of node B, indicating a short history of species colonizing Taiwan.

