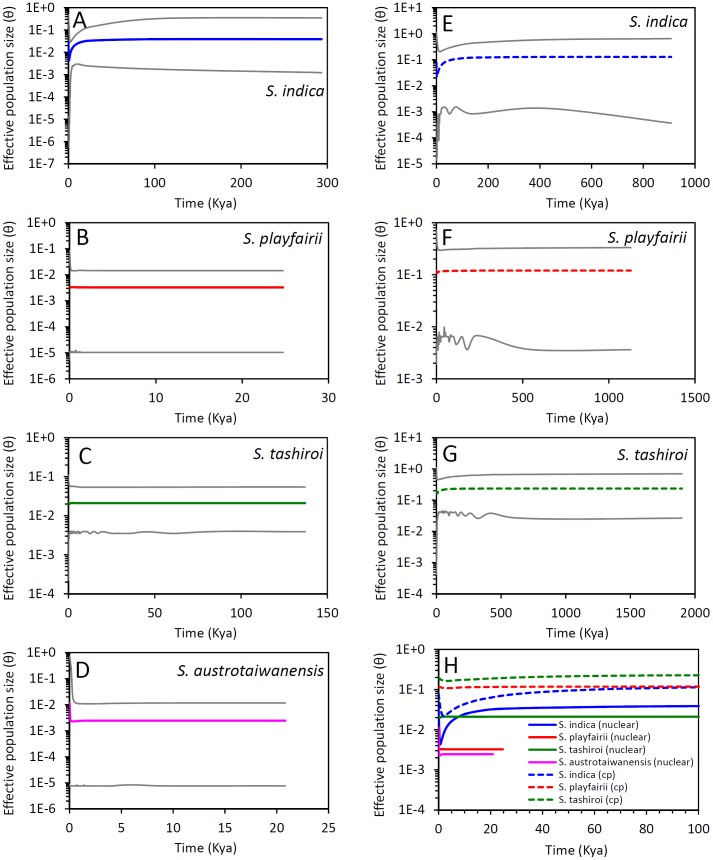
Figure 5. Extended Bayesian skyline plots (eBSPs) of members of the indica group in Taiwan.
A–D are eBSPs inferred from nuclear loci, and E–G are eBSPs of chloroplast (cp) loci. Figure H is a close look at the eBSPs of all species since 100 Kya. Solid and dotted lines indicate the median curves of the eBSPs inferred from nuclear and cpDNA, respectively. The gray curves are the 95% highest posterior density intervals of the eBSPs. Note that the very recent population size increase of S. austrotaiwanensis was inferred from nuclear loci, and a very recent recovery of the effective population sizes after bottlenecks was inferred in S. indica. Population sizes of both S. playfairii and S. tashiroi are constant in coalescent processes. The chloroplast eBSPs could not be inferred in S. austrotaiwanensis because of monomorphism.

