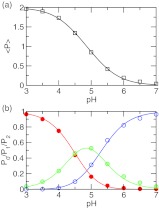
Figure 5.
Simulated titration of azelaic acid. (a) The average number of bound protons at each pH. Best fit to the data using Eq. 24 is shown as solid curve. The resulting pKa’s are 4.4 and 5.3. (b) Fraction of the population having two (P2, red), one (P1, green), and zero (P0, blue) bound protons at each pH. Best fits to Eqs. 20, 21, 22 are shown as solid curves. The two pKa’s obtained in all three fittings are within 0.2 units from those obtained in (a).

