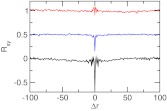
Figure 8.
Correlated titration of the two carboxylic groups in glutaric acid. Rxy is the normalized cross-correlation function based on the λ values of two titrating sites at pH 4. Δr is the offset in the exchange cycles. Results based on the GB simulation, explicit-solvent simulation with and without charge leveling are shown in blue, red, and black, respectively. For clarity the baseline for the first two sets of data is shifted.

