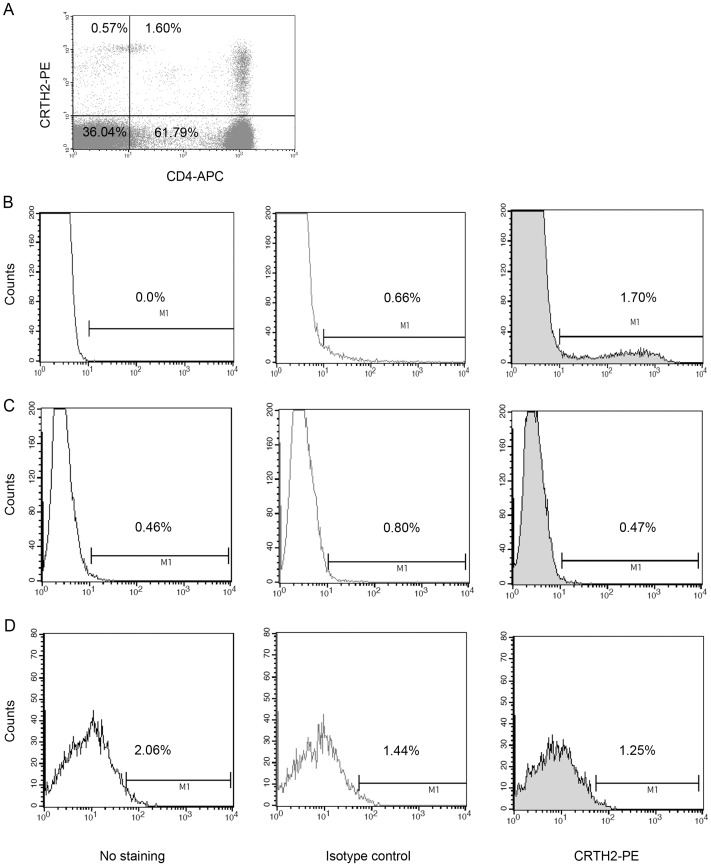
Figure 6. Flow cytometry for the detection of endogenous CRTH2.
Lymphocytes were gated according to forward scatter and side scatter and T helper cells were identified using CD4 as a cell surface marker (n = 6). A representative cytogram is presented with the right upper quadrant showing CRTH2+/CD4+ lymphocytes (A). Histograms showing no staining, isotype control and CRTH2+ labelled lymphocytes (B), amniocytes (C) and myocytes (D), (n = 5).

