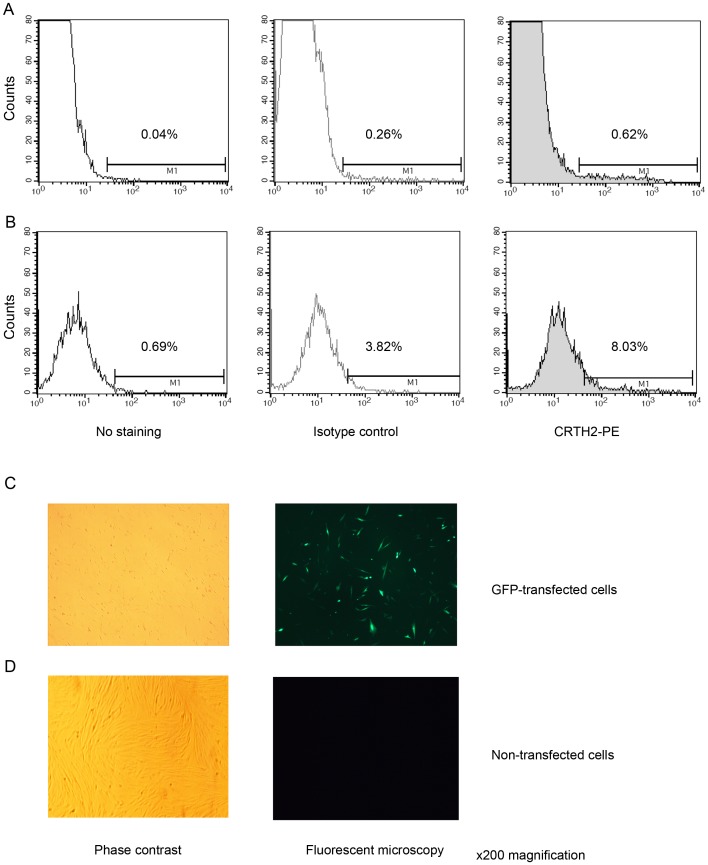
Figure 7. Flow cytometry for the detection of transfected CRTH2.
Amniocytes (A) and myocytes (B) were transfected using gene juice and electroporation respectively with CRTH2 PSG5 expression vector and labeled with anti-CRTH2-PE. A small shift to the right is seen in the histogram showing expression of CRTH2 in transfected cells with an increase in the mean fluorescence intensity from 87.75 in the isotype control to 143.49 in amniocytes, and from 68.84 to 96.97 in myocytes. An example of a GFP control is given for the myocyte transfection, with cells imaged with phase contrast and with the fluorescent microscope to detect GFP transfected cells (C). A direct comparison is also shown with non-GFP transfected cells (D).

