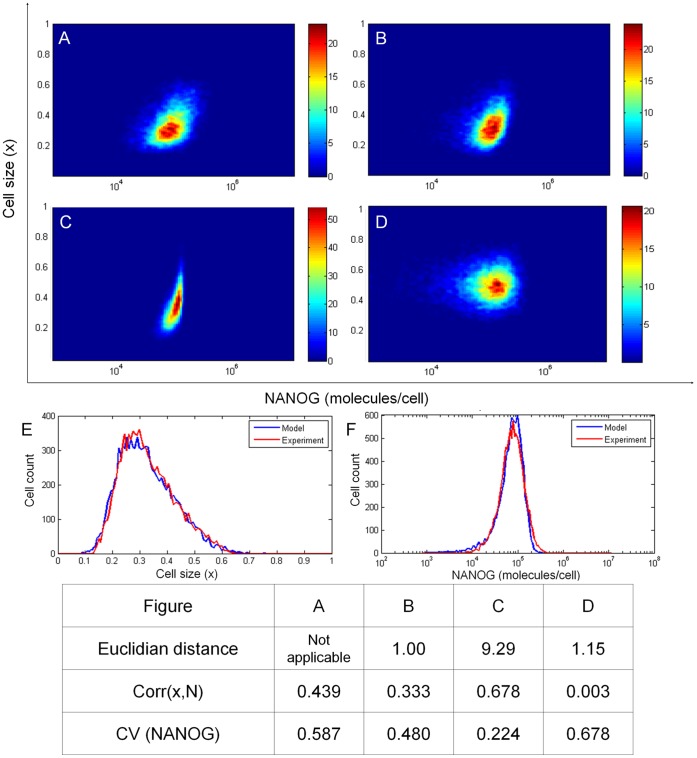
Figure 3. Comparison of PBE simulation results with data from experiments on hESC size and NANOG expression.
Data from (A) hESC cultures were compared to those from the model considering (B) both cell division and NANOG expression noise, (C) only cell division, or (D) only NANOG expression noise. In (B)-(D), the model was run for an interval of four doubling times. Color bars indicate cell count values (zero moment of the density function). Plots are based on 10,000 cells. (E–F) Comparison of cell size and NANOG expression distribution between experiment and PBE model with both cell division and NANOG expression distribution considered. Euclidian distance was calculated with respect to the experimental data set. Correlation coefficients for hESC size and NANOG as well as the CV for NANOG distributions are also listed. Cell size was normalized to [0,1].

