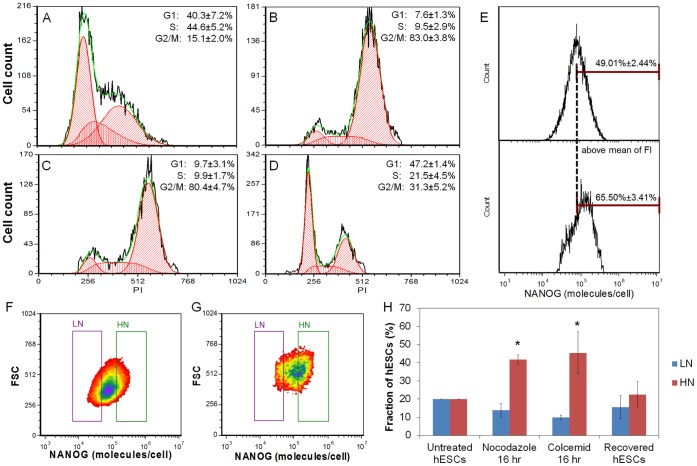
Figure 4. Proliferation arrest of hESCs and NANOG expression distribution.
(A–D) Cell cycle analysis performed via flow cytometry on (A) untreated hESCs, and hESCs treated with (B) 200 ng/ml nocodazole or (C) 100 ng/ml colcemid for 16 hrs. (D) Human ESCs after a 2-hr recovery following nocodazole treatment as in (B). Flow cytometry data (black curves) were analyzed using the FCS Express 4.0 software (red, green curves). Results are shown as mean ± standard deviation from at least three independent experiments. (E) Histograms of NANOG expression for (top) untreated and (bottom) nocodazole-treated self-renewing hESCs. The dashed line denotes the mean NANOG fluorescence intensity (MFI) of untreated hESCs. The fractions (%) show the cells with fluorescence intensity above the MFI value. (F) The LN and HN regions were defined by 20% of hESCs with the lowest and highest NANOG expression, respectively. (G) The same gating criteria were applied to Nocodazole-treated NANOG+ hESCs; (H) The percentage of LN and HN hESCs under the conditions indicated: (i) Untreated hESCs (normal hESCs), (ii) hESCs treated with 200 ng/ml Nocodazole or (iii) 100 ng/ml colcemid for 16 hr, and (iv) hESCs recovered 24 hr after a 16-hr treatment with nocodazole. Error bars are calculated from at least three independent experiments (*p<0.001).

