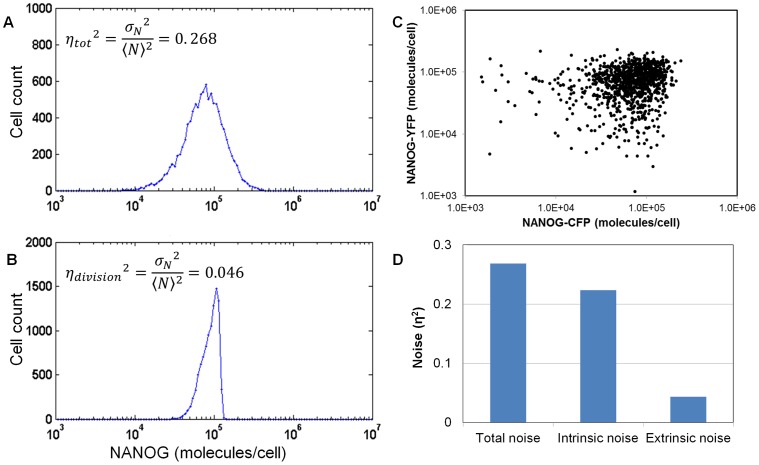
Figure 6. Quantitation of noise in NANOG expressed by hESCs.
Total noise in NANOG expression profile (A) obtained by flow cytometry analysis of cultured hESCs and (B) as predicted by the model with gene expression noise set to zero. (C) Scatter plot from simulation of a dual-reporter assay with 10,000 cells expressing NANOG-CFP and NANOG-YFP. Both stochastic partitioning and gene expression were taken into account. (D) Quantification of intrinsic and extrinsic noise components (Eq. 17–19).

