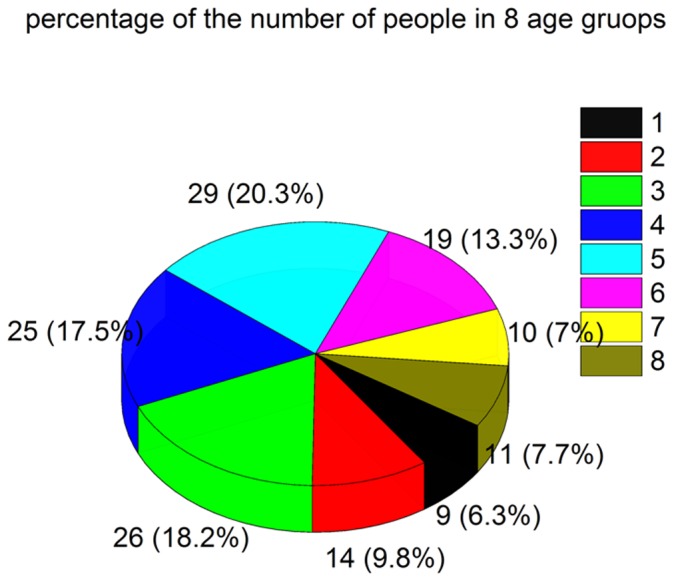
Figure 4. Numbers and percentages of individuals in each of the eight age groups of the total 143 subjects.

group 1 (9, 6.3%), group 2 (14, 9.8%), group 3 (26,18.2%), group 4 (25,17.5%), group 5 (29,20.3%), group 6 (19,13.3%), group 7 (10,7%), and group 8 (11,7.7%).
