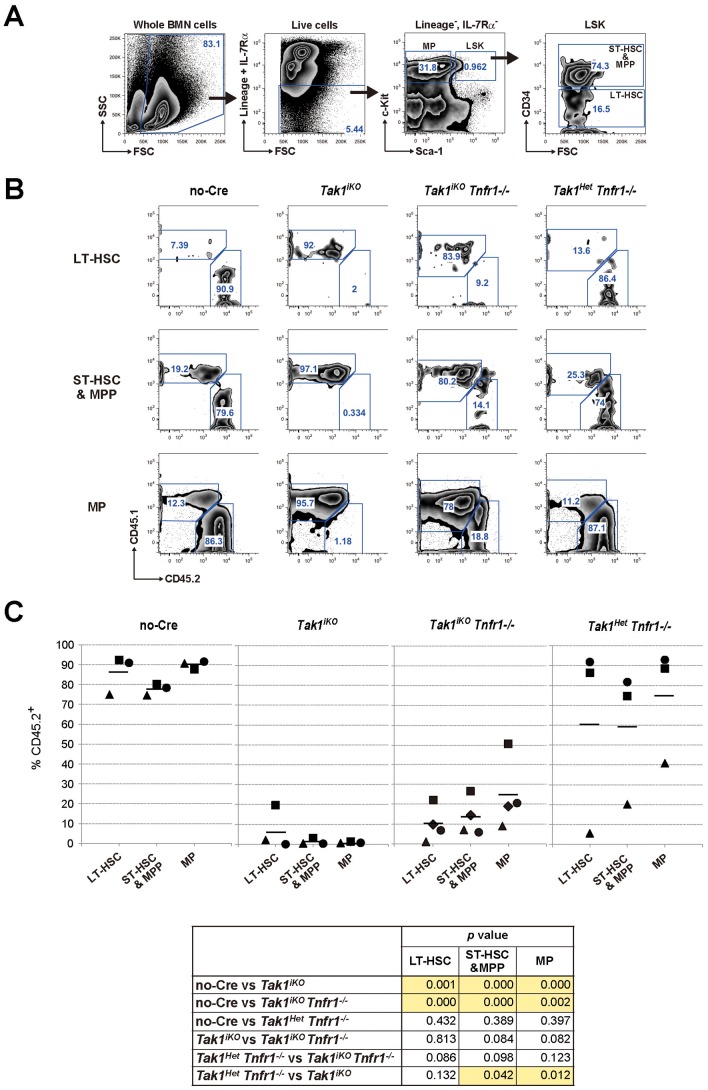
Figure 6. Impaired LT-HSC function by Tak1 deficiency cannot be rescued by ablation of TNF signaling.
(A) Gating strategy for LT-HSC, ST-HSC/MPP and MP in the competitive reconstitution assay. (B) Representative results of chimerism analysis of No-Cre, Tak1iKO, Tak1iKO Tnfr1−/−, and Tak1Het Tnfr1−/− test donor transplanted mice are shown. (C) The chimerism of LT-HSC, ST-HSC/MPP and MP in the recipient mouse BM. Lethally irradiated recipient mice (CD45.1+) were transplanted with a mixture of 5×10⁵ test (controls, No-Cre and Tak1Het Tnfr1−/−; and Tak1 deficient, Tak1iKO and Tak1iKO Tnfr1−/−, CD45.2+) and 5×10⁵ competitor wild type (CD45.1+) BMN cells. The recipients were i.p. injected with tamoxifen at 160 mg/kg body weight for three consecutive days starting at six weeks post transplantation. Twenty-two weeks or more after tamoxifen injection, recipients were analyzed for the chimerism of LT-HSC (CD34−, LSK), ST-HSC/MPP (CD34+, LSK) and MP (LK) in BMN cells. The chimerism in each recipient is plotted, and the bars represent the average. The table shown below the graphs indicates statistical significance for the indicated comparisons. P values of less than 0.05 are highlighted. Mice were i.p. injected with tamoxifen at 160 mg/kg body for three consecutive days (Tak1iKO, Tab1iKO, Tab2iKO and Tab1Tab2iDKO) or untreated (Tak1FF, Tak1FF Cre or Tab1Tab2FF) and sacrificed on day 4. Genomic DNA isolated from BMN cells was analyzed by qPCR using primers designed to detect a portion of the genome flanked by two loxP sites to determine the relative copy number of intact Tak1, Tab1 or Tab2 genome. Data are presented as mean ± S.D. of three independent experiments. Mice with the indicated genotype were i.p. injected with tamoxifen (160 mg/kg) for three consecutive days, and splenocytes were collected at Day 14 (left panels) or Day 4 (right panels). Whole cell extracts were prepared and analyzed by Western blot using the indicated antibodies. Asterisks indicate non-specific bands. Mice with the indicated genotype were i.p. injected with tamoxifen (160 mg/kg body weight) for three consecutive days, and BMN cells were collected at Day 4. (A) The number of total BMN cells of femurs and tibias were counted on hemacytometer. The cell number in MP or LSK population was determined by FACS analysis. Data are presented as mean ± S.D. (n = 3) (*p<0.05) (B) Representative FACS plots for Sca-1 vs c-Kit in lineage-negative population of BMN cells are shown. The gates for MP and LSK and percentages of each population are indicated. (A) 2×10⁵ BMN cells from Tab1FF, Tab1iKO, Tab2FF, or Tab2iKO mice (CD45.2+) were transplanted into lethally irradiated recipients (CD45.1+) together with 2×10⁵ competitor wild type BMN cells (CD45.1+). At six weeks post transplantation, the chimerism of myeloid, T and B cells in the recipients’ PB was analyzed, then the recipients were i.p. injected with tamoxifen (160 mg/kg body weight) for three consecutive days. The chimerism of PB cells was monitored every three weeks. In each experiment, a CD45.1/CD45.2 mixture of BMN cells was transplanted into two recipients, and the average of their blood cell chimerism is shown. (B) Splenocytes from control No-Cre or Tab2iKO transplanted mice (#1 and #2) at 21 weeks post-tamoxifen injection were sorted into the CD45.1+ or CD45.2+ population. Total cell lysates from the sorted splenocytes were analyzed by SDS-PAGE and Western blotted with indicated antibodies. The positions of molecular weight markers are shown on the right. The asterisks indicate the non-specific bands. Mice with the indicated genotype (the same animals used for the in vitro LSK expansion assay in Figure 3) were i.p. injected with tamoxifen (160 mg/kg body weight) for three consecutive days, and BMN cells were collected at Day 4. BMN cells were analyzed by FACS to determine the number of B cell (B220+), T cell (CD3ε+) and granulocyte (CD11b+ and Gr-1+) per femurs and tibias. Data are presented as mean ± S.D (n = 3).

