Figure 2. GC-Mass spectrum of methylselenol.
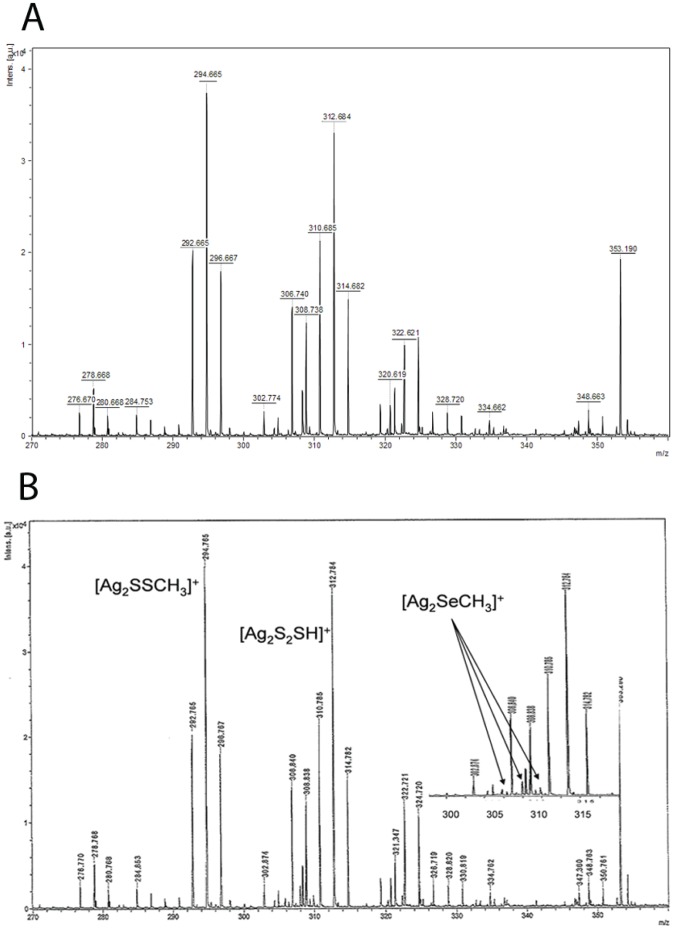
Positive ion LDI-TOF mass spectrum in the 270–360 m/z region of the precipitated silver salts. A) In absence of Trx1, no peaks corresponding to [Ag2SeCH3]+ ion were detected. B) However, in the presence of Trx1, the spectrum shows the [Ag2SeCH3]+ ion (peaks in the range 304.8–314.8 m/z) overlapped with more abundant Ag2-containing clusters. In particular, low-intensity peaks at 305.8, 307.8 and 309.8 m/z (designated by arrows) denote the presence of selenium in the [Ag2SeCH3]+ molecule.

