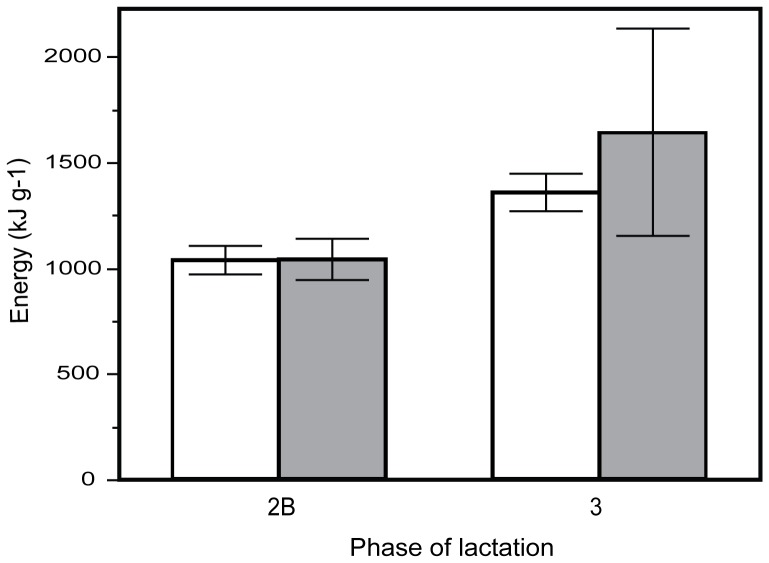
Figure 2. Gross milk energy content during phase 2B and phase 3 of lactation.
Mean changes (± s.e.) in the energy content of milk from Tammar wallaby mothers raising sons (shaded bars) and those raising daughters (open bars) during phase 2B and phase 3 of lactation. Despite the allocation of different milk components the total energy content of the milk is not significantly different between the milk allocated to sons and daughters.

