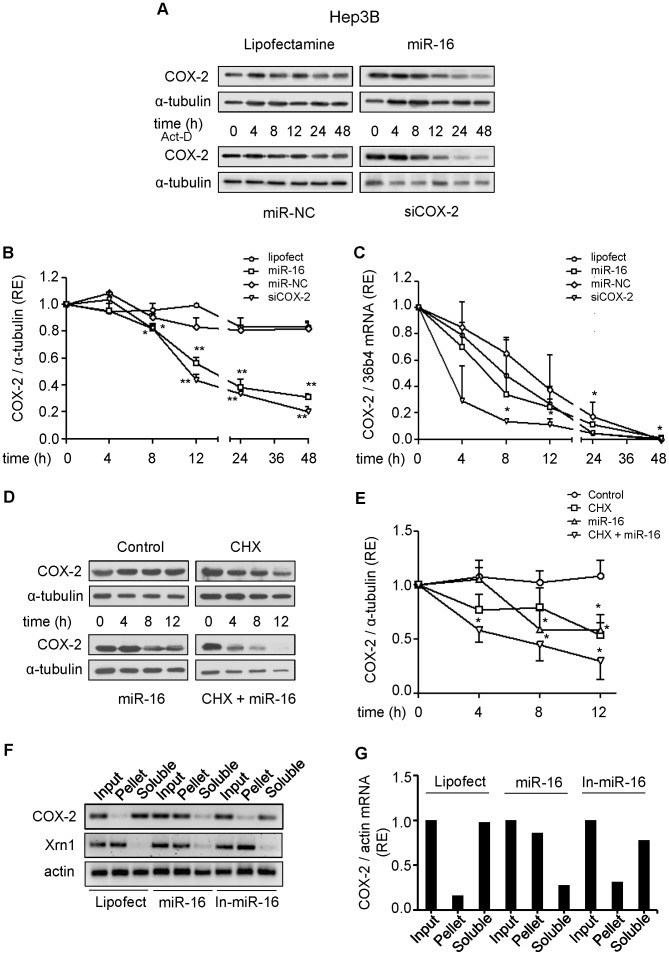
Figure 4. Effect of miR-16 on COX-2 mRNA and protein stability.
Hep3B cells were transfected with 50 nM miR-16 or miR-NC, or 30 nM siCOX-2. 5 µg/ml actinomycin-D (Act D) or 10 µg/ml cycloheximide (CHX) were added after transfection. (A–B) COX-2 protein was analyzed by Western blot at different time after actinomycin-D treatment. Corresponding densitometry analysis is shown and the relative expression of each sample is related to sample at 0 h as 1. (C) mRNA COX-2 levels were analyzed by real time PCR. COX-2 mRNA amounts were calculated as relative expression and normalized to the expression of 36b4 mRNA. Values represent fold change relative to sample at 0 h. (D–E) COX-2 protein levels were analyzed by Western blot in the presence or absence of cycloheximide. Corresponding densitometric analysis is shown and the relative expression of each sample is related to the value at 0 h as 1. F) Hep3B cells were transfected with 50 nM miR-16, miR-16 inhibitor (In-miR-16) or lipofectamine and permeabilized with digitonine to obtain soluble and pellet fractions enriched in PB as described in Methods. RNA was isolated from each fraction with Trizol reagent, reverse transcriptased, and PCR amplified with COX-2, Xrn1 and actin primers. Input, RNA extracted from cells prior to fractionation. PCR products were visualized by electrophoresis in SYBR Safe DNA gel stain agarose gels. G) The presence of COX-2 mRNA in soluble and PB fractions was assessed and fold differences were plotted. Data are reported as means±SD of three independent experiments. **p<0.01 and *p<0.05 vs. the value of sample at 0 h.

