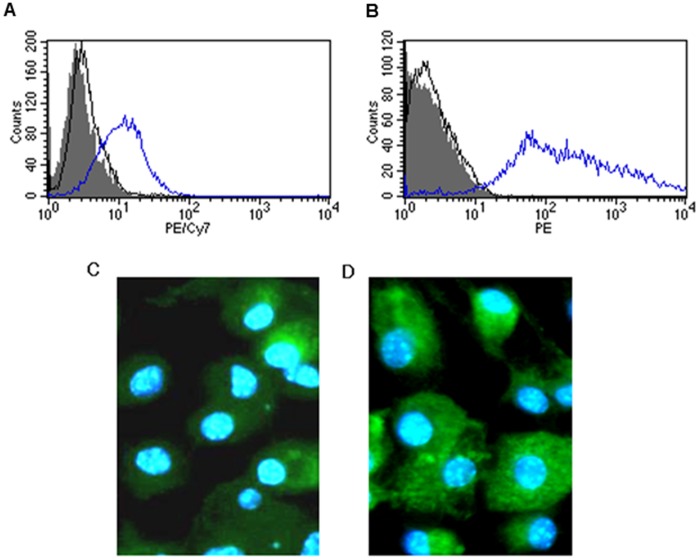
Figure 1. Cell characterization and lectin profile of the mouse bone marrow derived macrophages.
Histogram showing the percentage of positive stained mouse bone marrow derived macrophages by flow cytometry (open peak-blue line). Isotype control (open peak-black line) and non-stained cells as negative control (shaded peak) of bone marrow derived macrophages stained with (A) CD14 and (B) F4/80. Lectin immune-staining assay to determine the sialic acid (SA) distribution on mouse bone marrow derived macrophages. (C) Maackia amurensis lectin (MAA) conjugated with FITC (the lectin that binds SA-α2,3Gal linked sialic acid) and (D) with Sambucus nigra lectin (SNA) conjugated with FITC (the lectin that binds SA-α2,6GalNAc).

