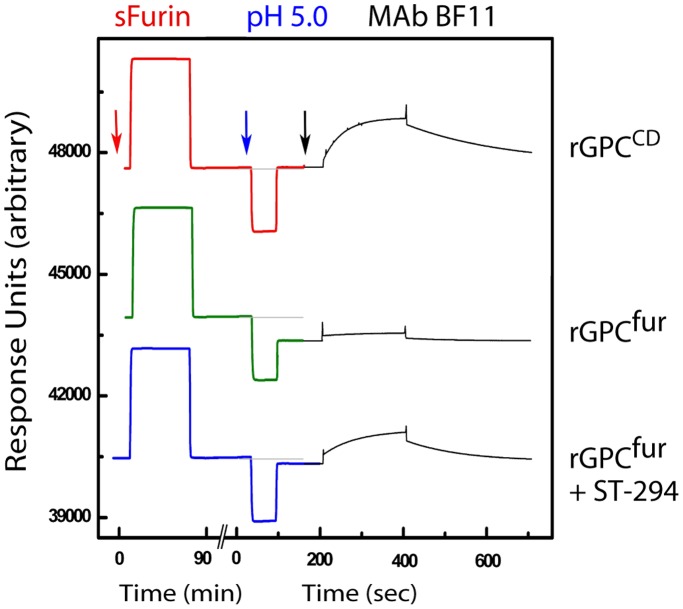
Figure 4. SPR analysis of pH-induced G1 shedding.
rGPC was immobilized onto a Biacore L1 chip and reconstituted in a lipid bilayer as described [27]. The figure includes a composite of SPR responses from single-chip experiments in which rGPCCD (top trace) or rGPCfur (bottom two traces) were sequentially incubated with sFurin (red arrow), exposed to pH 5.0 (blue arrow), and probed with the G1-specific MAb BF11 (black arrow). In the lower trace, 20 µM of ST-294 was present throughout the experiment. The relative baseline before exposure to pH 5.0 is shown as a gray line and the absolute RU values on the y-axis are arbitrary.

