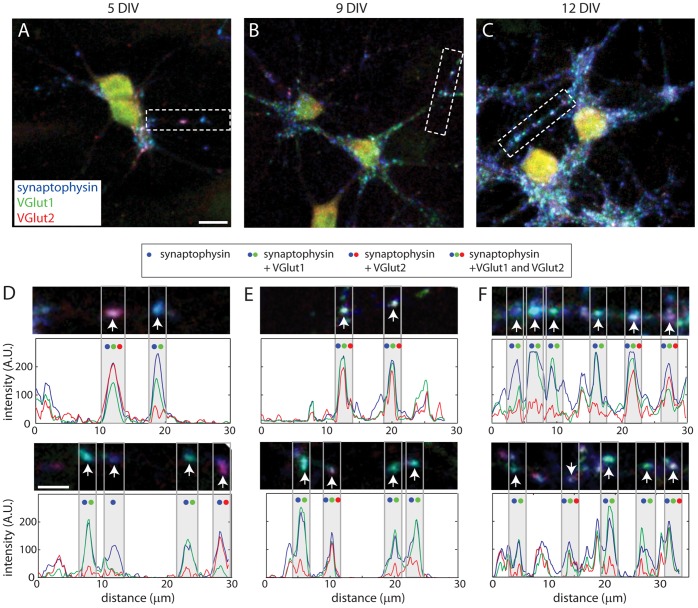
Figure 1. Throughout early postnatal development, cortico-cortical synapses are observed with VGLUT1, VGLUT2 or both VGLUT1 and VGLUT2.
(A, B and C) Images of 5, 9 and 12 DIV neurons immunolabeled for synaptophysin (blue), VGLUT1 (green) and VGLUT2 (red). Scale bars, 10 µm. (D, E and F) Higher magnification images. The images of the top row in (D–F) are from the regions indicated by the dashed boxes in A-C. Scale bars, 5 µm. Arrows indicate the positions of presynaptic puncta in each image. Below each image, an intensity profile is shown, depicting the intensity of synaptophysin (blue), VGLUT1 (green), and VGLUT2 (red) along the axon in the image. The peaks that correspond to the presynaptic puncta, indicated by the arrows in the images, are highlighted with gray bars. Blue, green and red dots above each peak indicate whether synaptophysin (blue), VGLUT1 (green) or VGLUT2 (red) are found at each terminal, as indicated by the key.

