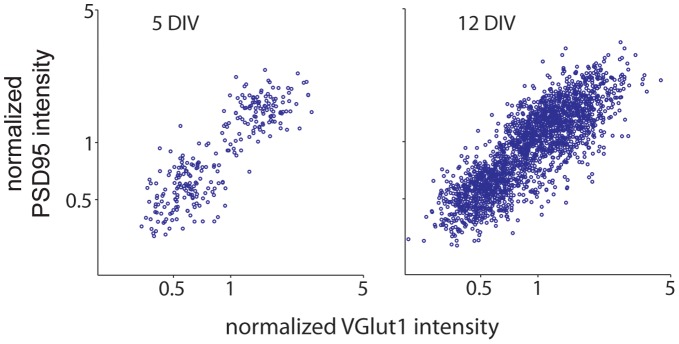
Figure 4. Presynaptic VGLUT1 and postsynaptic PSD95 expression levels are correlated at individual synapses at all ages studied.
Scatter plots of VGLUT1 versus PSD95 at 5 (left) and 12 (right) DIV. The Pearson’s correlation coefficient for the intensities of VGLUT1 and PSD95 was significant at 5 to 12 DIV (5 DIV: r = 0.839 with a 95% confidence interval of 0.800–0.871; 12 DIV: r = 0.775 with a 95% confidence interval of 0.757–0.792, p<0.0001 for both 5 and 12 DIV). At 5DIV, n = 275 synaptophysin and VGLUT1-positive puncta from 11 images in 2 experiments. At 12 DIV, n = 2093 puncta from 12 images in 2 experiments.

