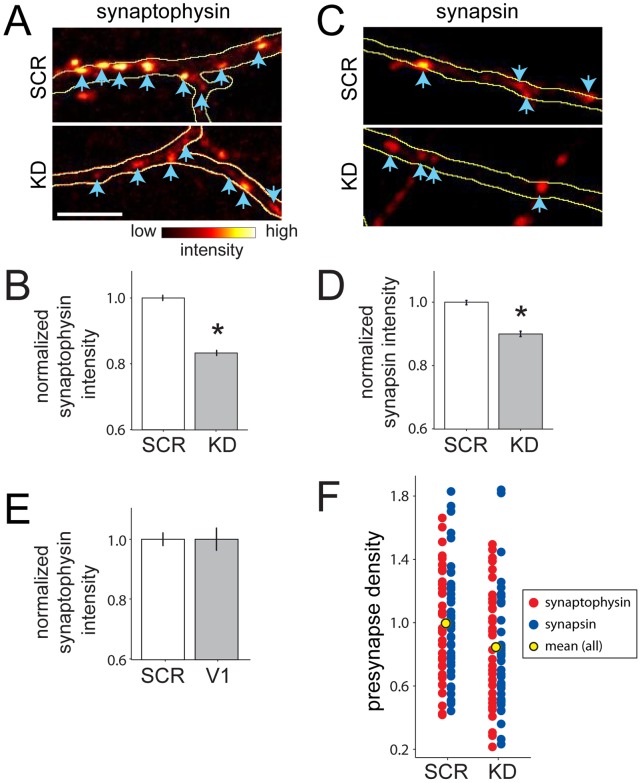
Figure 7. Knockdown of VGLUT1 results in a concomitant decrease in synaptic expression of synapsin and synaptophysin.
(A) Images of fluorescently labeled synaptophysin puncta for control (SCR, top), and VGLUT1 knockdown (KD, bottom) axons. Intensities were measured for the individual puncta (blue arrows) that fell within the confines of the fluorescently labeled axon (outlined in yellow). (B), The mean synaptophysin intensity decreased significantly in KD neurons. *, p<0.0001 (n = 1305, and 978 puncta from 36 and 35 axons for SCR and KD, respectively, from 3 independent experiments). (C) Images of fluorescently labeled synapsin puncta for control (SCR, top), and VGLUT1 knockdown (KD, bottom). The intensities of puncta (blue arrows) that fell within the confines of the fluorescently labeled axon (outlined in yellow) were quantified. (D) Mean synapsin intensity decreased significantly in KD neurons. *, p<0.0001 (n = 1802 and 1539 puncta from 57 and 51 axons for SCR and KD axons, respectively, from 3 experiments). (E) Synaptophysin was not decreased in KD neurons co-expressing VGLUT1 (V1, VGLUT1 expressing neurons; p = 0.940; n = 244 and 96 puncta from 13 and 9 axons for SCR and V1, respectively, from a representative experiment. The same results were observed in 3 independent experiments). (F) Plot of presynaptic density in SCR versus KD axons. Synaptophysin densities from individual images are indicated by red dots and synapsin densities are indicated by blue dots. The mean synapse densities for pooled synapsin and synaptophysin axons are indicated by yellow dots. The synapse density in KD neurons was decreased by 15±4% as compared to SCR (p<0.05, n = 76 and 72 SCR and KD axons from 6 independent experiments).

