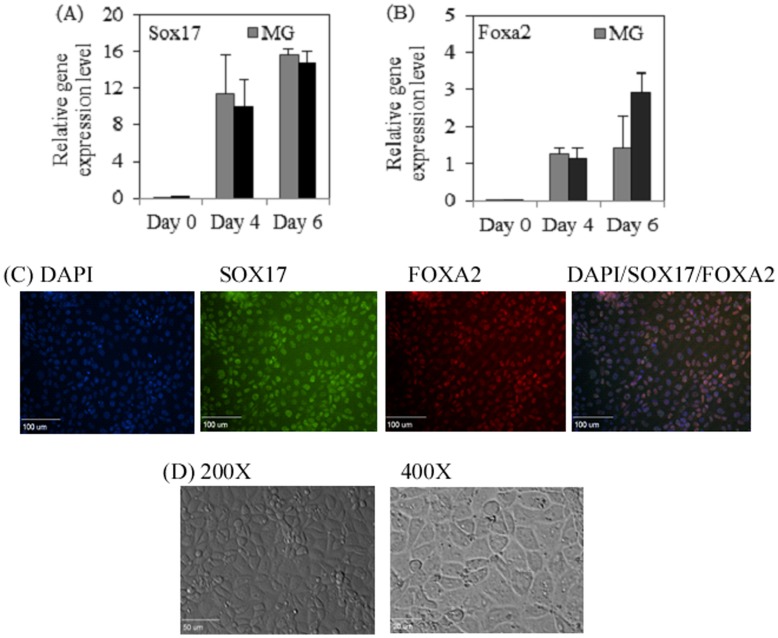
Figure 2. Definitive endoderm (DE) differentiation of hiPSC on Matrigel and Synthemax Surface.
The expression of SOX17 (A) and FOXA2 (B) was normalized to their expression levels in adult pancreatic (AP) tissues. Data is presented as mean ± SD from three independent experiments. p-value = 0.917 for SOX17 and p-value = 0.668 for FOXA2. (C) Immunofluoresent staining for SOX17 and FOXA2 DE markers in hiPSCs differentiated on SM. (D) Phase contrast images of hiPSC morphology after DE differentiation on SM. Majority of the cells exhibited endothelial-like morphology on day 6 post differentiation.

