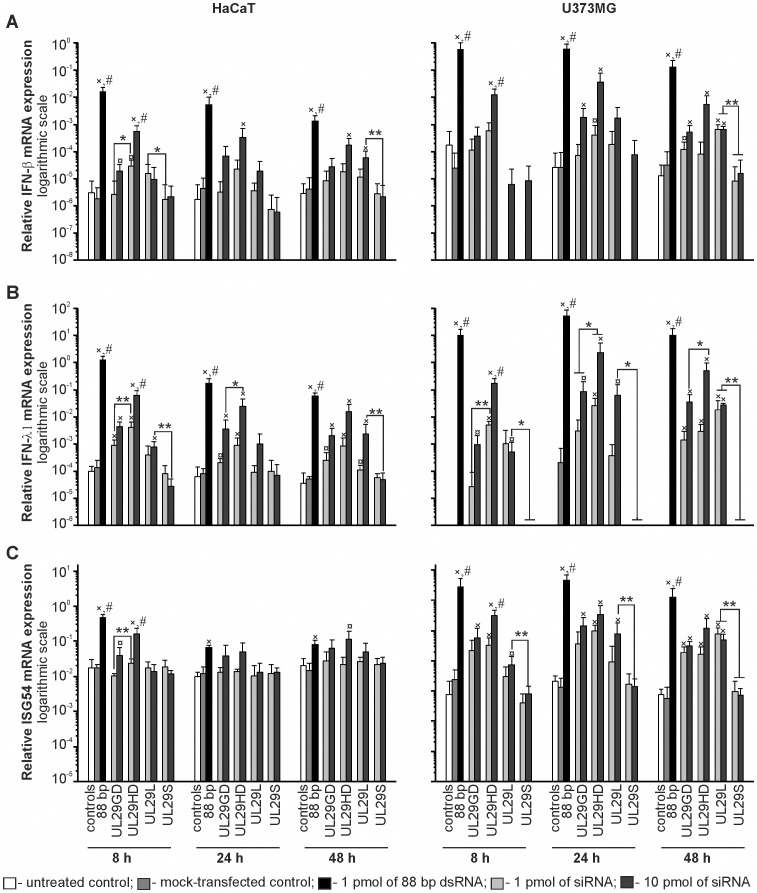
Figure 2. Innate immunity responses to siRNA pools and single-site siRNA molecules.
HaCaT and U373MG cells were transfected with either 1 (light grey) or 10 (dark grey) pmol of the indicated siRNA molecules; 1 pmol of 88-bp dsRNA (black bar) or water (control, grey bar); or left untreated (control, white bar). The expression levels of IFN-β (A), IFN-λ1 (B) or ISG54 (C) were assessed by qRT-PCR 8 h, 24 h or 48 h post transfection. Values were normalized to the GAPDH housekeeping gene and shown on a logarithmic scale. The mean values+S.D. of at least two independent experiments, each with a minimum of three biological replicates, are shown. Data were compared by Mann-Whitney U-test. The statistical significance is indicated as (×) p < 0.01 or (¤) p < 0.05 against the controls; (**) p < 0.01 or (*) p < 0.05 against a group of comparison; (#) p < 0.01 against all other transfections. UL29GD, GD-digested anti-UL29 siRNA pool; UL29HD, HD-digested anti-UL29 siRNA pool; UL29L, 27-nt chemically synthesized anti-UL29 siRNA; UL29S, 21-nt chemically synthesized single anti-UL29 siRNA. No significant signal was detected for IFN-λ1 mRNA in U373MG cell culture (B, right panel) if no dsRNA was applied (non- and mock-transfected cells).

