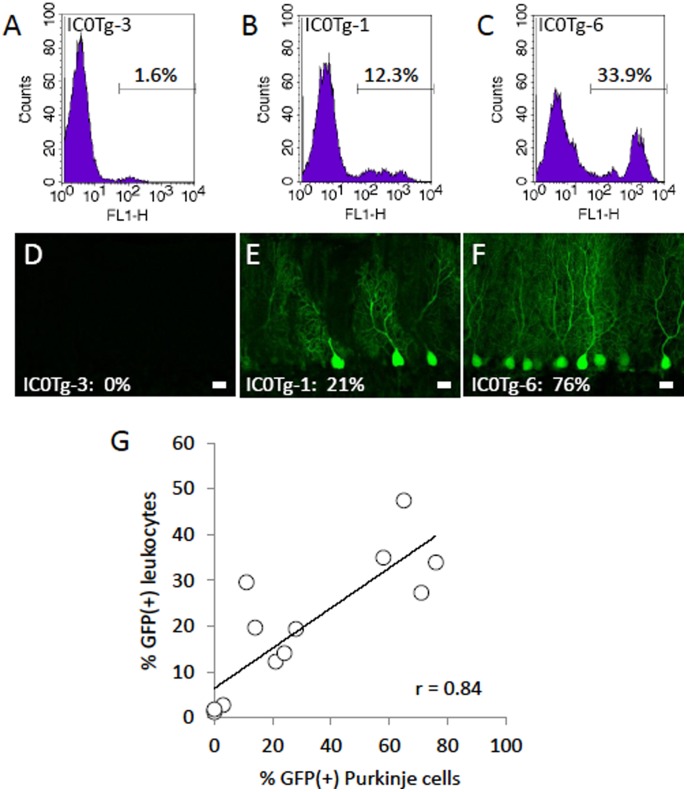
Figure 3. Significant correlation between the frequencies of GFP-positive leukocytes and GFP-expressing Purkinje cells.
(A–C) GFP fluorescence of peripheral circulating leukocytes was analyzed by flow cytometry. (D–F) Sagittal sections of the cerebellar vermis from the same animals (A–C) are shown. The results were obtained from IC0Tg-3 (A, D), IC0Tg-1 (B, E) and IC0Tg-6 (C, F) mice (see Table 1). Scale bar, 20 µm. (G) The frequency of GFP-expressing leukocytes (% GFP(+) leukocytes) obtained from 12 MSCV-GFP founder mice was plotted against the frequency of GFP-expressing Purkinje cells (% GFP(+) Purkinje cells). The correlation coefficient (r) was 0.84, indicating a significant correlation between the two values.

