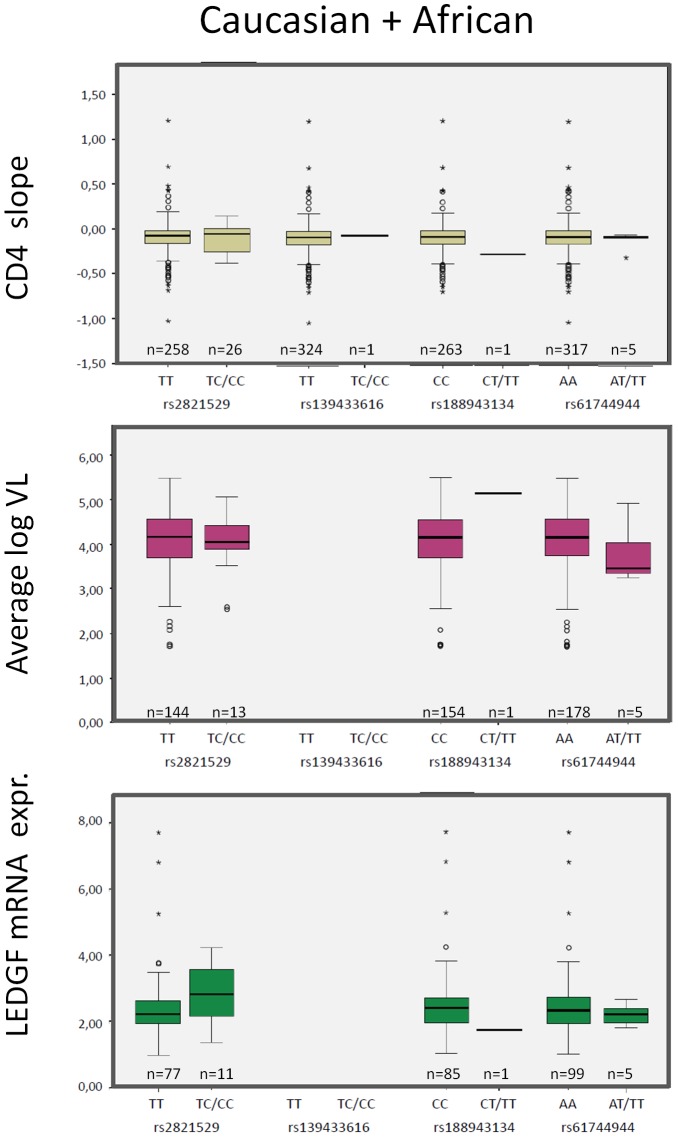
Figure 2. Phenotypic impact of observed genetic variants in the PSIP1 coding region.
Box-plots showing the association of individual observed SNPs in the coding region with CD4 decline (top), average log viral load (middle) and LEDGF/p75 mRNA expression (bottom).The data are combined for Africans and Caucasians. SNPs not in accordance with Hardy-Weinberg law (rs35678110) were excluded. In case of insufficient data to create a boxplot (limited amount of data points) a bar representing the mean of the values is shown.

