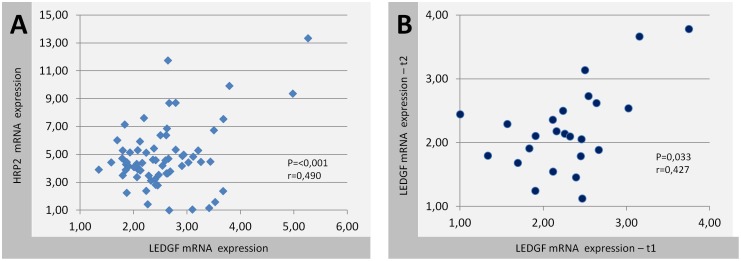
Figure 4. Biological variability and correlation of LEDGF/p75 mRNA with HRP2 mRNA expression.
(A) Scatter-plot showing LEDGF/p75 mRNA and HRP2 expression in identical patient samples (n = 68). Pearson r-values and p-values are indicated. (B) Scatter-plot showing the biological variation of LEDGF/p75 mRNA expression in two samples from 24 patients at different time points. t1 = time point 1; t2 = time point 2.

