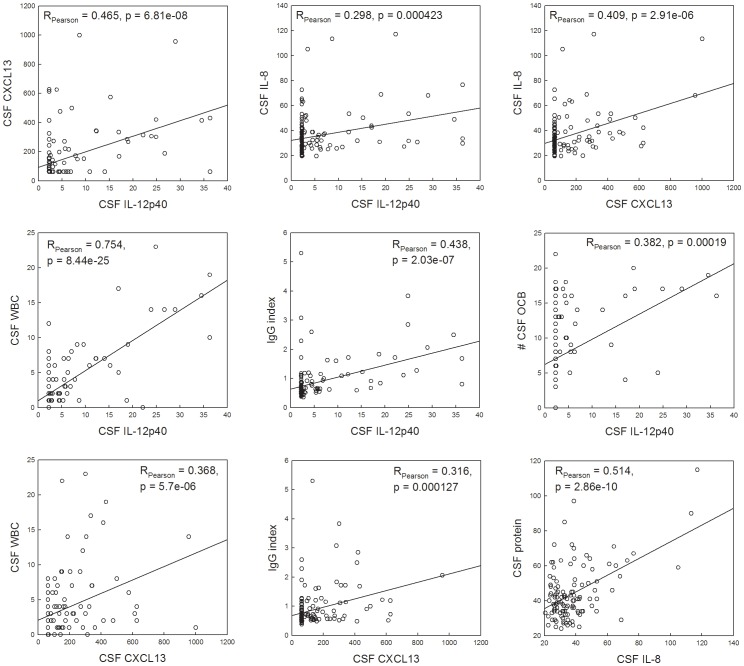
Figure 2. Correlations between CSF IL-12p40, CXCL13 and IL-8 (all measured in pg/ml) and traditional clinical measures of intrathecal inflammation: CSF biomarkers measured by NIH clinical laboratory: WBC count (# of cells per mm3 measured in unspun CSF), IgG index (normal range 0.26–0.62), OCB and total protein (g/dl) and CEL measured as described in detail in method section.
Correlation coefficients and p values are detailed in each panel. The data originate from the confirmatory (NIB) cohort only.

