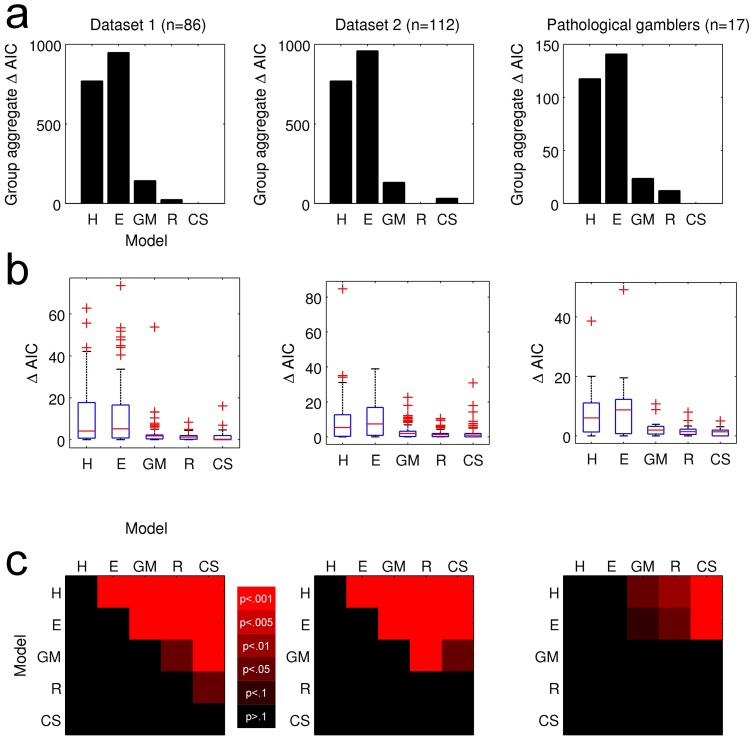
Figure 3. Model comparison based on AIC.
a) Group-aggregate ΔAIC scores for each model were calculated by summing AIC scores over all subjects and then substracting each model's AIC score from the best-fitting model's AIC score, yielding a ΔAIC of 0 for the best-fitting model. b) Boxplots of single-subject ΔAIC values. c) P-values from Wilcoxon rank-sum tests conducted on ΔAIC values for each model pairing.

