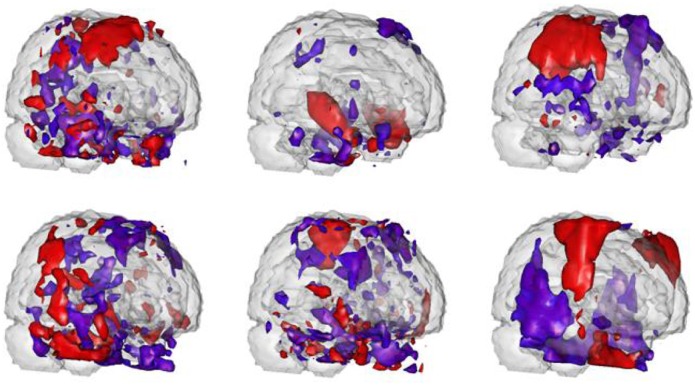
Figure 3. Three-D rendering of thresholded spatial maps associated with the significant predictors.
Red areas load positively while blue areas load negatively. The figures from the upper left to the upper right are spatial maps of IC 11, 13 and 19 respectively. The figures from the lower left to the lower right are spatial maps of IC 22, 26 and 28 respectively.

