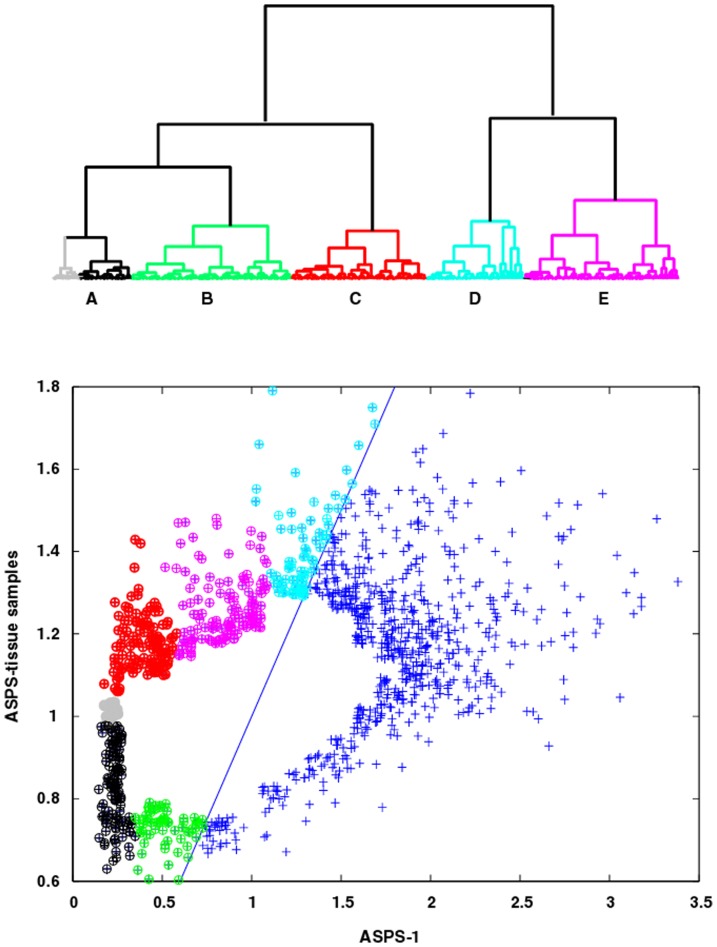
Figure 3. Top Panel; Dendrogram for pooled ASPS-tissue Gene Expressions.
Clades are colored to identify samples associated with five meta-clades (DEND meta-clades A, B, C, D and E). The members of DEND meta-clade A with ASPS-tissue values higher than universal RNA are displayed in gray. All other meta-clades are comprised of genes with expression values above universal RNA (i.e. values above 1.0 on the y-axis). Bottom Panel, ASPS-tissue versus ASPS-1 scatter plot where cluster memberships are color-coded to match the meta-clade dendrogram displayed in top panel.

