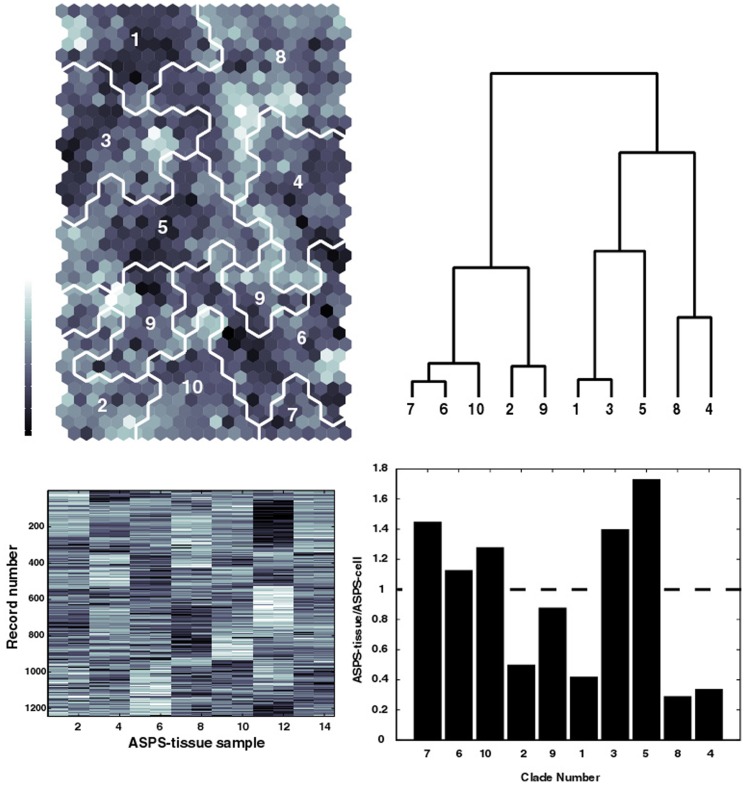
Figure 5. Top left panel displays the SOM for the 1244 individual patient gene expressions from ASPS-tissue and ASPS-1 (1244 genes).
SOM colors indicate the similarity of gene measurements between SOM clusters (dark∶ similar light∶less similar). Dendrogram (clipped at 10 SOM meta-clades) from hierarchical clustering of SOM codebook vectors is displayed in the upper right panel. Corresponding SOM meta-clades are identified on the SOM by the white boundary lines. Matching labels appear on the SOM regions and SOM dendrogram. Lower left panel displays the gene expression measurements for the 1244 ASPS-tissue genes for 7 patients, done in replicate. Records are ordered from top to bottom from the left to right meta-clades of the dendrogram. Record boundaries are: SOM meta-clade 7; rows 1–41, SOM meta-clade 6; rows 42–256, SOM meta-clade 10; rows 257–340, SOM meta-clade 2; rows 341–425, SOM meta-clade 9; rows 426–526, SOM meta-clade 1; rows 527–646), SOM meta-clade 3; rows 647–787, SOM meta-clade 5; rows 788–934, SOM meta-clade 8; rows 935–1143, SOM meta-clade 4; rows 1144–1244, Lower right panel displays the histogram for the ratio of counts of genes in the ASPS-tissue set to counts of genes in the ASPS-1 set. Dashed horizontal line defines cases where equal fractions of ASPS-tissue and ASPS-cell genes occur in a meta-clade. Here SOM meta-clades (7, 6, 10, 3 and 5) represent ASPS-tissue genes greater in abundance than found for ASPS-1 genes.

