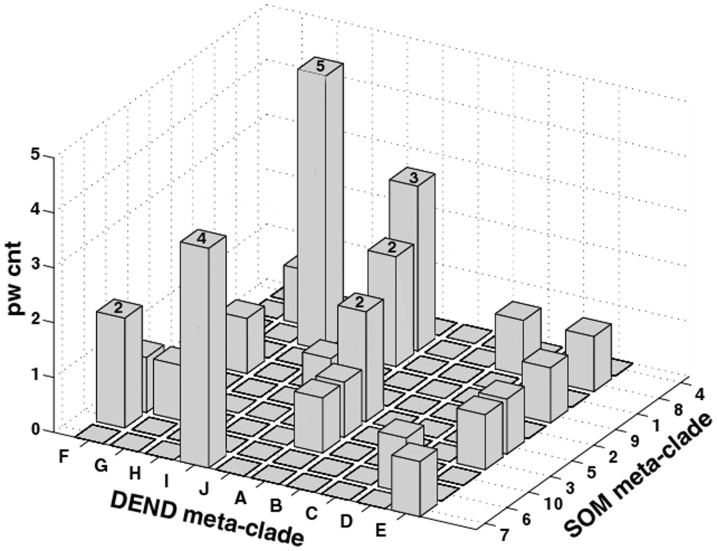
Figure 6. Three-dimensional histogram for count of pathways (pw cnt) shared from the GSEA analysis of gene expressions derived from the patient pooled/ASPS-1 data (axis labels DEND meta-clade, with clade letters A–J) and the individual patient data (axis labeled SOM meta-clades, with meta-clades numbered 1–10).
Genes designated with an asterisk are common to pathways identified using the ASPS-tissue: ASPS-1 data set and the individual patient dataset.

