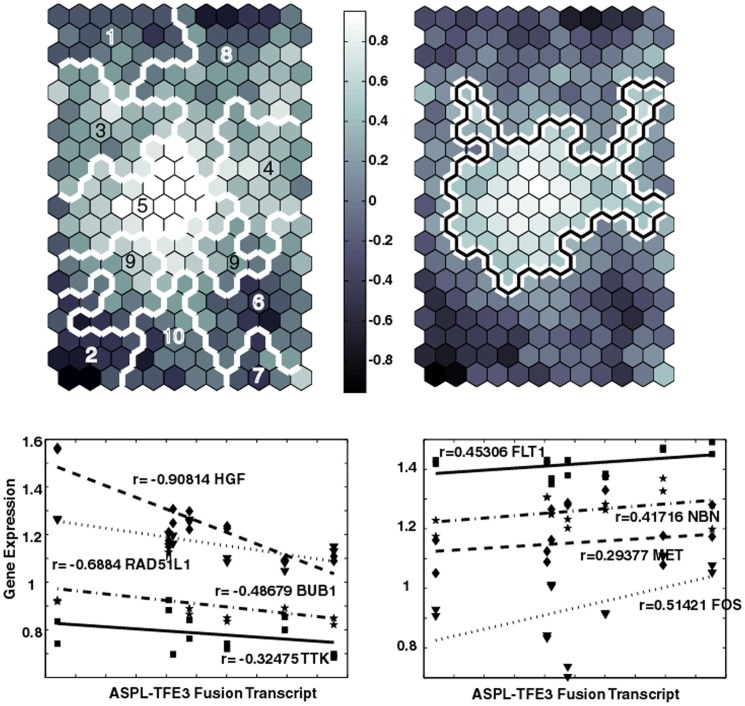
Figure 7. Upper left panel displays SOM (20×12) based on the 1244×14 patient gene measurements.
Colors represent the PCCs of the ASPL-TFE3 fusion transcript values against the SOM codebook vectors for each cluster. These codebook vectors represent the best representative of the gene expressions contained within a SOM cluster (typically 5–10 genes). White boundaries correspond to SOM meta-clades. Upper right panel displays the same SOM image with the boundary line (white with black inlay) identifying clusters with the most significant positive PCC values (ASPL-TFE3 fusion transcript versus patient gene expressions). The region scribed by this boundary encompasses most of SOM meta-clade 5, and includes portions of SOM meta-clades 3, 4, 8 and 9. Lower panels plot patient ASPL-TFE3 fusion transcript to gene expressions for selected genes. Lower left and right panels depict examples of negatively and positively correlated genes, respectively. Positive: FLT1:SOM meta-clade 8 MET:SOM meta-clade 9, PGF SOM meta-clade 3, NBN SOM meta-clade 8. Negative: HGF:SOM meta-clade 2, BUB1:SOM meta-clade 1, RAD51L1:SOM meta-clade 7, TTK:SOM meta-clade 1.

