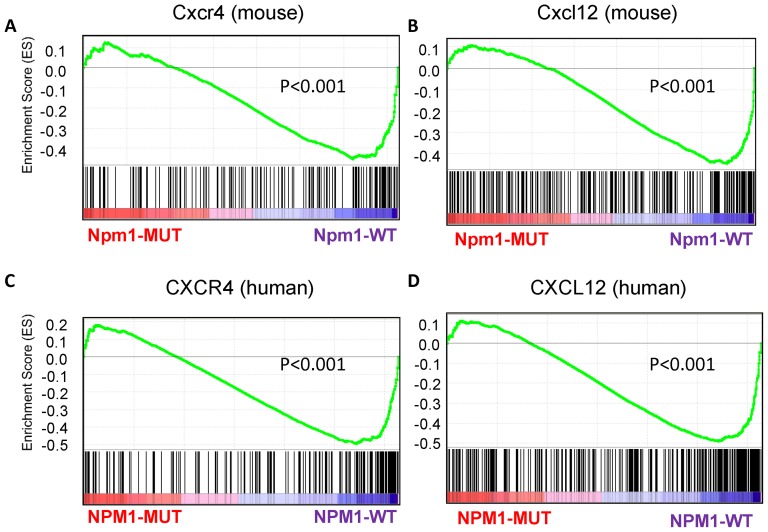
Figure 6. Enrichment plots from gene set enrichment analysis (GSEA).
The enrichment plots contain profiles of the running enrichment scores (ES) and positions of gene set members on the rank ordered list in GSEA. (A) Cxcr4 and (B) Cxcl12 interaction signatures on the mouse data. (C) CXCR4 and (D) CXCL12 interaction signatures on the human data.

