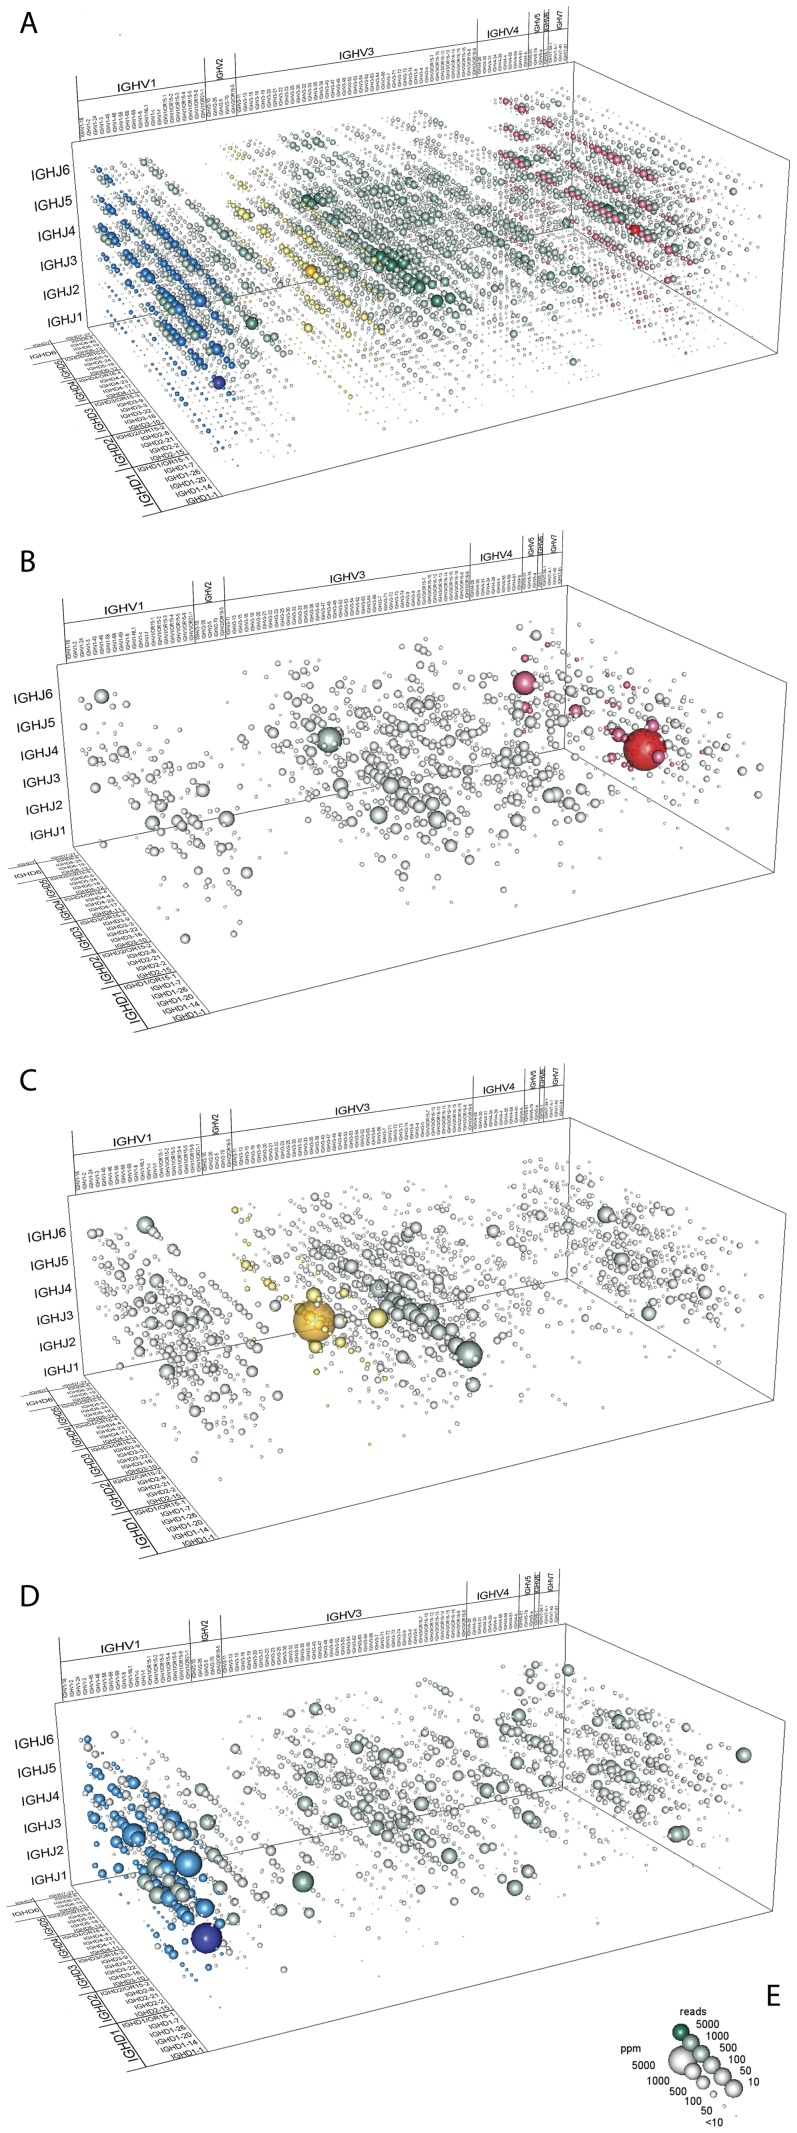
Figure 3. In detail analysis of VDJ rearrangements.
(A) Overall distribution of VDJ rearrangements in 14 donors. (B) IgA2-specific VDJ rearrangements in donor I200091-032. (C) IgA1-specific VDJ rearrangements in donor I200091-030. (D) IgG1-specific VDJ rearrangements in donor I200091-021. (E) Gauge; sphere volumes refer to their respective numerical proportion. Less than 10 ppm are represented by a fixed size sphere. Green color shading indicates number of reads constituting respective recombination. Other colors highlight selected V-genes; blue: IGHV1-2, yellow: IGHV2-5, red: IGHV4-34.

