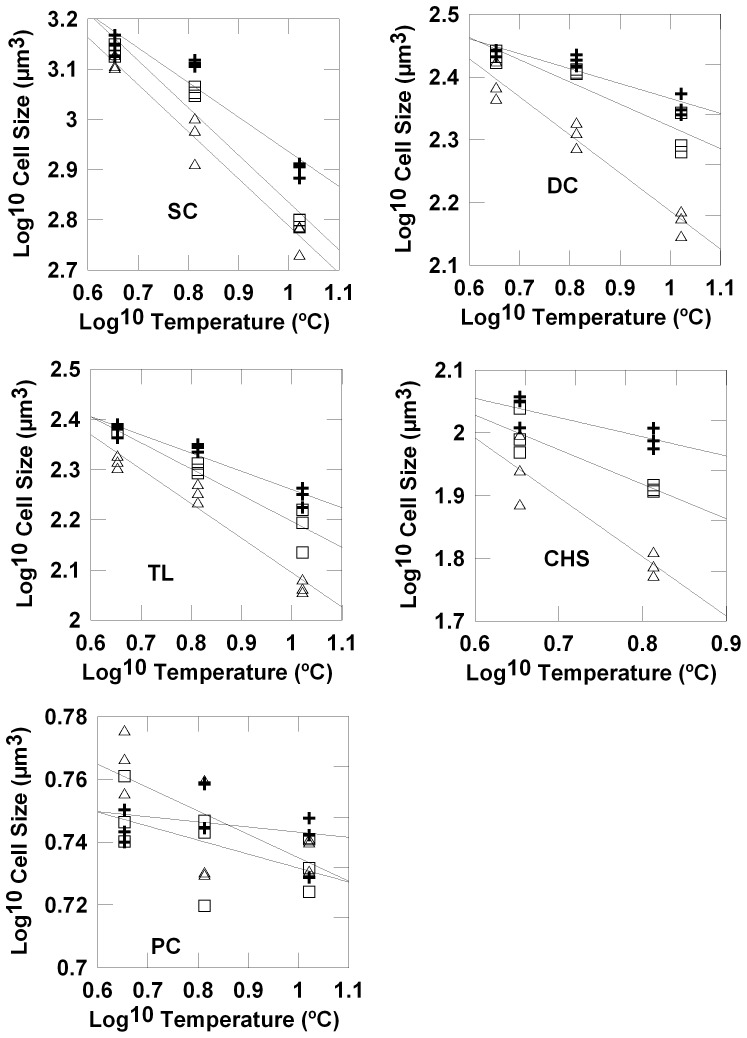
Figure 1. Temperature and grazing effects on the size of individual phytyplankton species, experiment 1.
Regressions of mean cell sizes of individual species (log10 transformed, µm3) on temperature (log10 transformed, °C) for the different grazing regimes (nanozooplankton-N: crosses; microzooplankton-M: open squares; copepods-C: open triangles; SC: Scrippsiella trochiodea, DC: Dictyocha speculum, TL: Teleaulax amphioxeia, CHS: Chaetoceros similis, PC: picophytoplankton.

